On this page
Water quality testing is a classic science project for Class 11 and 12 students. It moves chemistry from the textbook into the real world. By checking tap water, pond water, or well water, you test exactly what people consume or what aquatic life depends on.
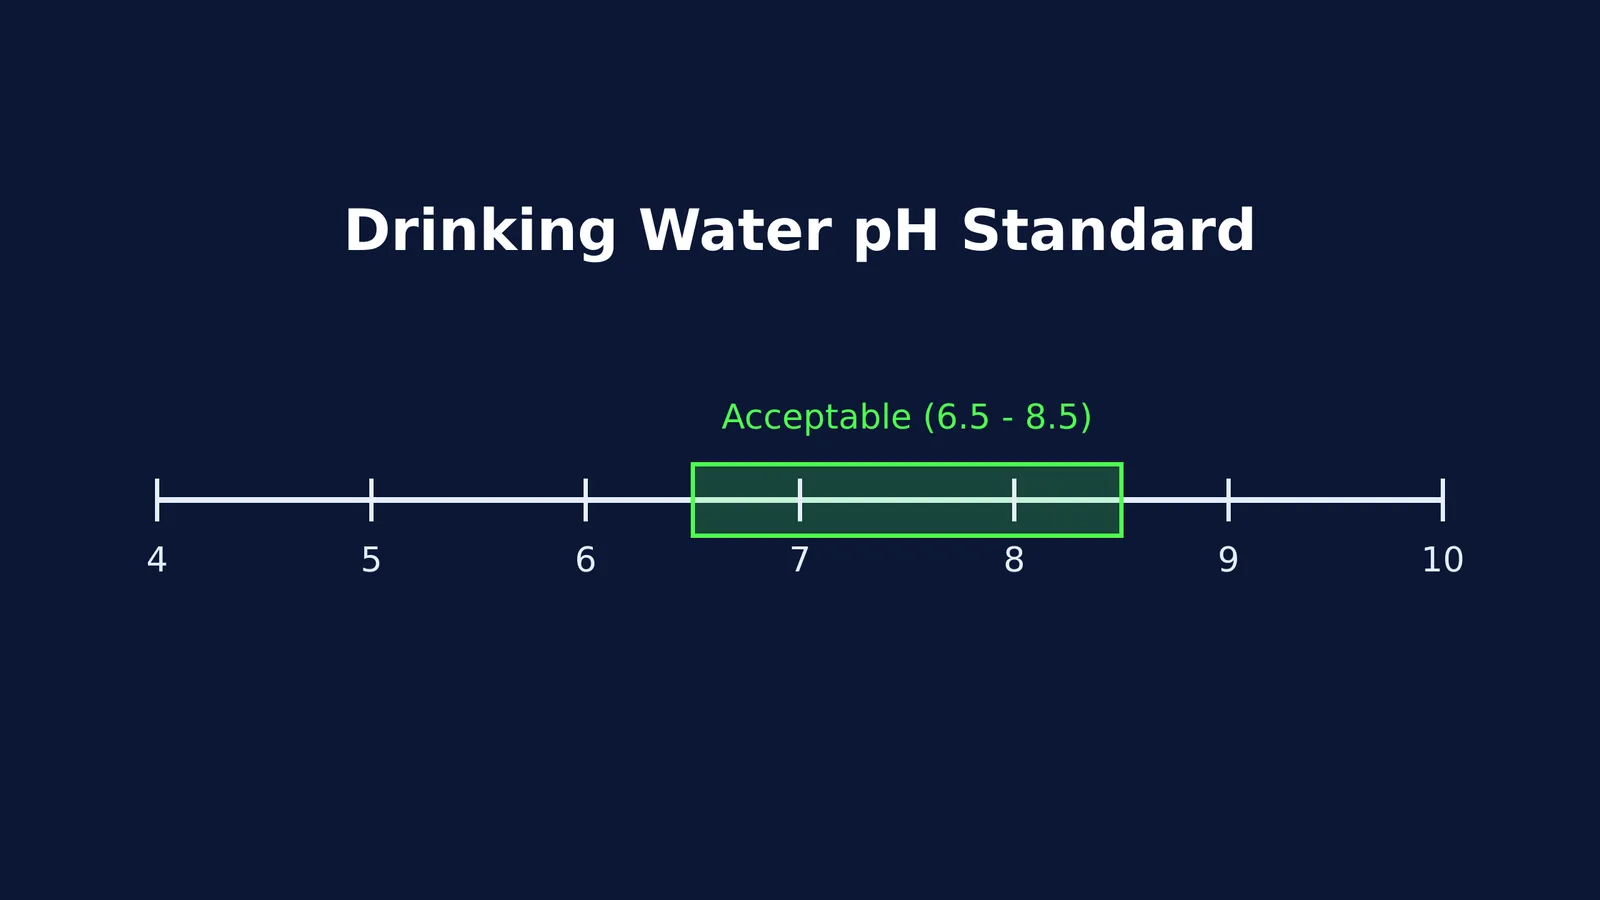
In India, the Bureau of Indian Standards sets the rules. The IS 10500:2012 drinking water specifications dictate that acceptable pH must be strictly between 6.5 and 8.5. The same standard limits turbidity to 1 NTU (Nephelometric Turbidity Unit). It also caps total hardness at 200 mg/L as calcium carbonate for an acceptable drinking water source. Knowing these official benchmarks gives your school project a real scientific standard to measure against.
How do you measure pH, turbidity and hardness?
When you head to the lab, you will usually test three main parameters.
pH (acidity or alkalinity): You can use universal indicator drops or standard pH paper. Adding a few drops of indicator to your test tube turns the sample a specific colour. Tap water usually glows green or yellowish-green (around pH 6.8 to 7.2), while pond water might lean blue-green (pH 7.5 to 8.5) if algae are actively photosynthesising and removing carbon dioxide from the water.
Turbidity: Turbidity measures suspended particles like silt or organic matter. In a school lab, you can test this visually. Place a clear glass cylinder over a piece of white paper with a bold black cross drawn on it. Pour in the water sample until the cross disappears from view. The deeper the water required to hide the mark, the lower the turbidity. For precise measurements in NTU, a turbidity meter compares how much light scatters through the sample.
Hardness: Hard water contains dissolved calcium and magnesium ions. You usually measure this by titration with a chemical called EDTA, which binds to these metal ions. A colour-changing indicator like Eriochrome Black T tells you exactly when all the hardness ions have been captured. Alternatively, you can do a rough qualitative test by seeing how easily the water forms a lather with soap. The more soap you have to add before bubbles form, the harder the water. This relates directly to how soaps clean and micelles form in hard water.
What if your results look "wrong"?
Many students fall into a common trap during investigatory projects: they run the experiment, get a messy result, and then write down the "perfect" textbook number instead.
If you test your school's tap water and find a pH of 6.3, do not write down 7.0 just because water is supposed to be neutral. That slight acidity is real data. Perhaps the pipes are old, or the local groundwater naturally dissolves acidic minerals. For instance, if your turbidity test of pond water shows it is highly cloudy, that might just be recent rainfall churning up silt, rather than permanent pollution. Discussing this in your conclusion shows critical thinking.
In professional environmental science, unexpected numbers lead to discoveries. For example, Ruth Patrick used diatoms to show river health exactly because she paid attention to the messy, real-world biological data that others ignored.
When you record and discuss your actual findings—even if it means admitting a test tube was contaminated or a measurement was imprecise—you demonstrate the scientific method. Examiners look for students who can explain why their data deviated from the ideal, not just those who can copy a manual.
How does this connect to real-world science?
Testing water connects to much wider systems. Measuring turbidity and organic load is the first step in understanding sewage treatment and BOD (Biochemical Oxygen Demand).
If you want to understand the chemistry behind titration, the Fermi Concept Library has a lesson on every concept in chemistry. And if you are struggling to picture how those calcium and magnesium ions behave in solution, the Fermi Simulation Lab offers interactive simulations for ideas that are easier to see than to read.