On this page
Python and R are both powerful tools, but they solve different problems. According to the 2024 Stack Overflow Developer Survey, Python is used by 51% of all developers, while R sits at a niche 4.3%. This makes Python a strong choice for general-purpose software, backend development, and machine learning. But if you are a statistics student, popularity across all of software engineering is not the whole story.
Should statistics students learn R or Python?
Python is a generalist. It is built to write web servers, automate repetitive tasks, and train deep neural networks. R is a specialist. It was announced in 1993 by statisticians Ross Ihaka and Robert Gentleman specifically for data analysis and statistical computing (Wikipedia)).
If you plan to work in corporate software engineering or build artificial intelligence products, learn Python. If your goal is academic research, epidemiology, biostatistics, or producing high-quality charts for a scientific paper, learn R. Many modern professionals learn both, using Python for production code and R for exploratory analysis, but R's fundamental structure makes it the natural starting point for learning formal statistics.
Why is R good at data analysis?
In Python, data analysis is an add-on. You have to import external libraries like `pandas` just to view your data in a two-dimensional table. In R, data frames are built into the core language because the language expects you to be working with datasets. Statistical tests such as Student's t-test or linear regression (`lm()`) work directly out of the box without needing any extra installations.
R also uses the Tidyverse, a modern collection of packages that makes data wrangling read like an English sentence. Instead of writing complex, nested brackets to manipulate data, you use a pipe symbol (`%>%`) to pass data directly from one step to the next. You can filter rows, select specific columns, and summarize group means in a clean sequence that matches how a statistician thinks about the problem.
If you are struggling to map a statistical concept to its corresponding code, the Fermi Concept Library holds a lesson for every concept in mathematics and computing, helping you bridge the gap between theory and execution.
How does R plot data using the Grammar of Graphics?
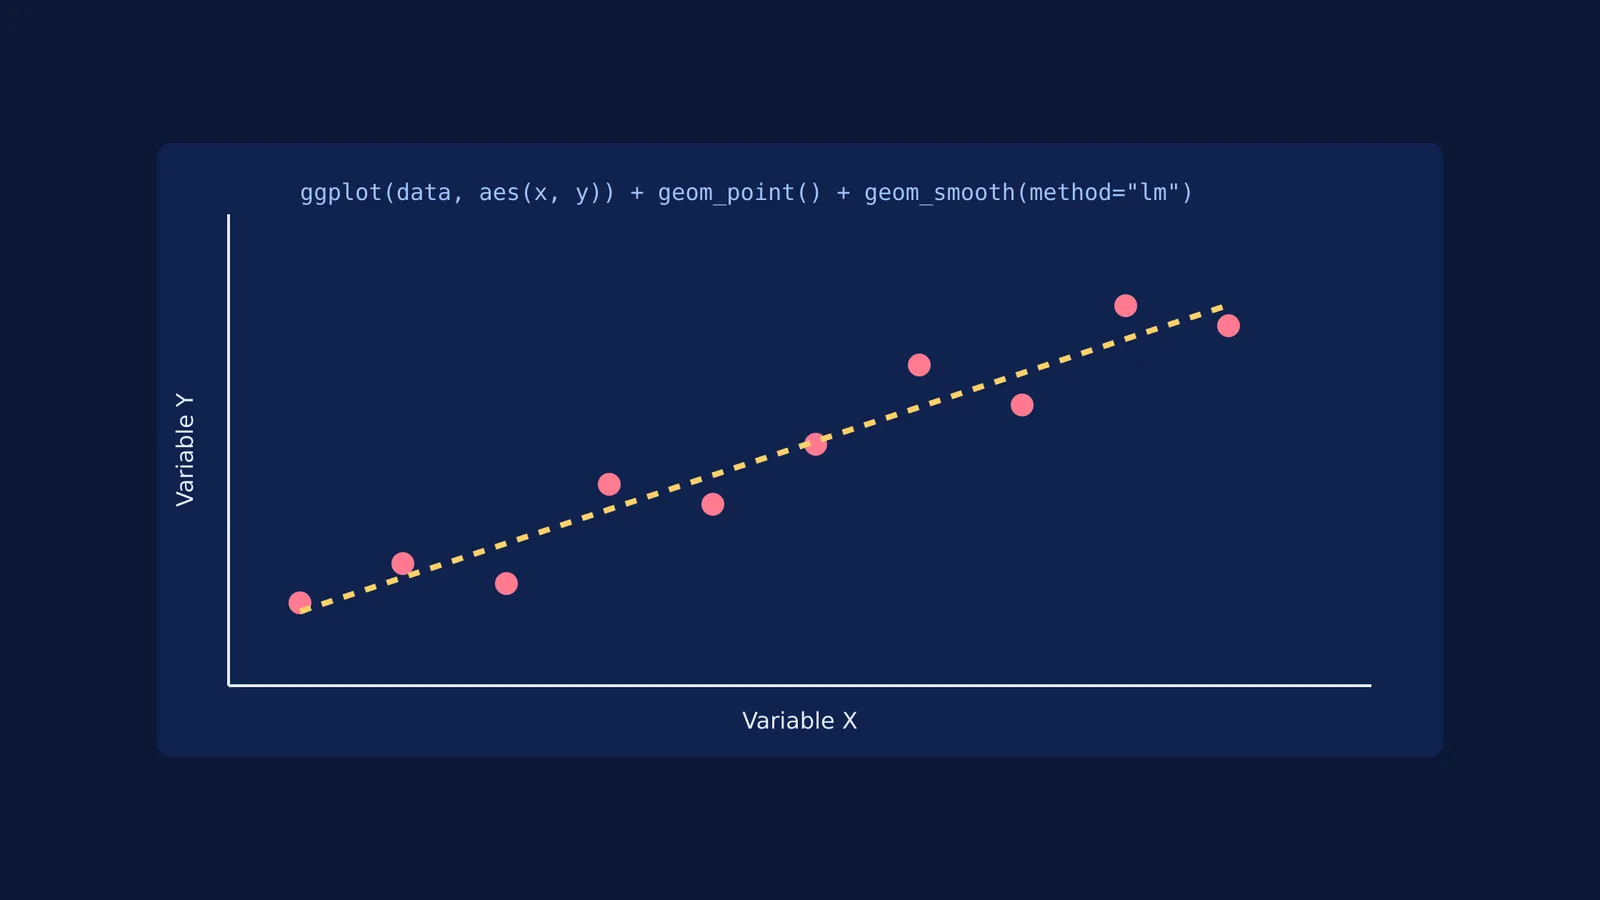
Visualisation is an area where R is particularly strong. In 2005, Hadley Wickham created `ggplot2`, an R package based on the "Grammar of Graphics" (Wikipedia). Instead of manually drawing lines and calculating axis limits, you build a plot logically in distinct layers.
You start with the raw data. Then, you add an aesthetic mapping—telling R which variable belongs on the x-axis, which belongs on the y-axis, and which variable determines the colour of the shapes. Finally, you add a geometry, such as a point (`geom_point()`) for a scatter plot or a bar (`geom_bar()`) for a histogram. With just three lines of code, R produces a publication-ready graphic. Adding a smooth trendline or splitting the chart by category takes just one more simple layer.
How can statistics students begin with R?
Do not start your journey by reading a dense textbook on R syntax. Start with a dataset you actually care about—perhaps historical sports scores, climate records, or a raw spreadsheet from your chemistry lab.
Install the tools: Download R and RStudio, the standard interface that makes writing R code much easier.
Load the Tidyverse: Run `install.packages("tidyverse")` and load your dataset using the `read_csv()` function.
Ask questions: Try to find the average of a specific column, or plot two variables against each other using `ggplot()`. Start small and build up.
Learn by doing: When you hit a wall with a confusing error message, do not just copy-paste the answer from a forum. Fermi's AI tutor teaches rather than answers; it notices where you are stuck and decides whether to explain, ask, or show, helping you fix your logic.
By learning R, you learn to think systematically about data. It turns abstract statistics from textbook formulas into a tangible tool you can see and manipulate. Once you are comfortable exploring and plotting data, you can use R to verify your answers to foundational statistics problems, such as how adding to or scaling data changes the mean and variance or simulating with and without replacement probabilities.