On this page
If your child knows Virat Kohli's score but groans at decimals, the scorecard is your way in. Every number on it is a division, fraction or percentage they already care about.
Why does cricket help children learn maths?
Maths problems set in a child's own interests can work better than standard ones. In a study published in 2013, Candace Walkington randomly assigned 145 ninth-grade Algebra I students using a computer tutoring system either to normal story problems or to problems matched to their out-of-school interests, such as sports, music and movies. The personalised group solved problems faster and more accurately. The effect was strongest for writing equations from story problems, and for students who were struggling.
India's National Education Policy 2020 leans in a similar direction. Paragraph 4.6 lists sports-integrated education among the experiential approaches to be used "within each subject", though the policy mainly has physical activity in mind. A cricket maths project at home is in the same spirit.
What are strike rate, run rate and batting average?
Each of these is a rate: how much of one thing per another.
Batting strike rate is the average number of runs scored per 100 balls faced. Formula: runs ÷ balls × 100.
Run rate is the average number of runs a batting side scores per over, extras included. An over is six legal balls.
Batting average is total runs divided by the number of times the batter was out. Not-out innings add runs but not dismissals.
That last rule makes a good puzzle. Don Bradman scored 6,996 Test runs in 80 innings and was not out in 10 of them, so his average is 6,996 ÷ 70 = 99.94, not 6,996 ÷ 80. Ask your child why the two answers differ.
How do you work out the numbers from a real match?
Take the scorecard of the 2024 Men's T20 World Cup final: India 176/7, South Africa 169/8, both in 20 overs, India winning by 7 runs. Work through this together with a pencil.
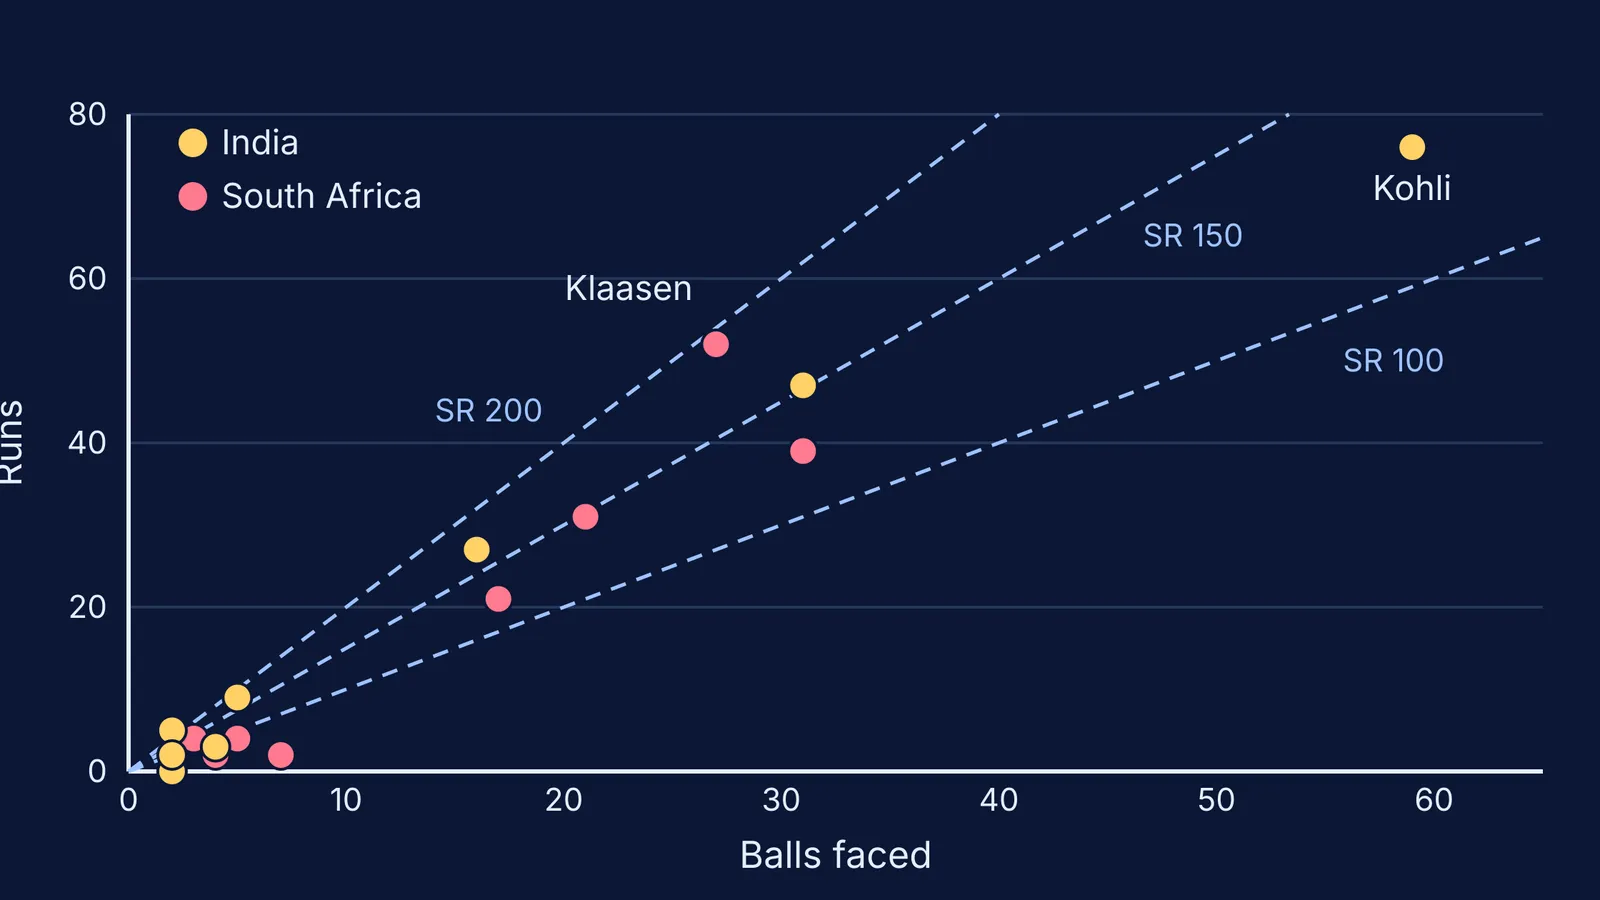
Strike rate. Kohli made 76 off 59 balls: 76 ÷ 59 × 100 = 128.8. Heinrich Klaasen made 52 off 27: 52 ÷ 27 × 100 = 192.6. Who scored more runs? Kohli. Who scored faster? Klaasen.
Run rate. India: 176 ÷ 20 = 8.8 runs per over. To win, South Africa needed 177, a rate of 8.85.
The turning point. Klaasen was out with the score at 151/5 after 16.1 overs. That is 97 balls bowled and 23 left, with 26 runs needed. Required rate: 26 ÷ (23 ÷ 6) = 6.8 per over. Run rate so far: 151 ÷ (97 ÷ 6) = 9.3. South Africa needed to score more slowly than they had been, and still lost: a good talking point about what numbers can and cannot predict.
Mean versus median. India's eight batters scored 0, 2, 3, 5, 9, 27, 47 and 76. The mean is 169 ÷ 8 = 21.1. The median is (5 + 9) ÷ 2 = 7. Which one describes a typical batter better, and why does one big innings pull the mean up?
The chart at the top plots every batter in that final, balls faced against runs. A dot above a dashed strike-rate line means that batter scored faster than that rate, which is an easy way into scatter plots and straight-line graphs.
What can children aged 9 to 15 do with cricket data?
Pick the step that fits your child, then move up.
Ages 9 to 11: add up a scorecard and check it against the total; count fours and sixes and turn them into runs; draw a bar chart of each batter's runs.
Ages 11 to 13: work out every batter's strike rate; turn "won 6 of 10 matches" into a fraction, a decimal and a percentage; keep a run tally for one IPL team across a week.
Ages 13 to 15: compare mean and median across a series; draw a runs-per-over bar chart or a running-total "worm" for one innings; plot balls against runs and draw the strike-rate lines yourself.
For the textbook side, see our guides to Class 9 statistics and helping with word problems.
What should you say to get started?
Keep it light and let your child lead. During the next match, try:
"Who do you think is batting better right now? How could we check?"
"They need 40 off 24 balls. Is that more or less than they've been scoring?"
"Your average went down even though you scored runs. How is that possible?"
If your child is sure they are "not a maths person", start with the team they support, not the textbook. Our piece on what to do when your child says they are bad at maths has more on that conversation.
When a cricket question exposes a gap, such as why the median ignores a big score, the Fermi Concept Library has a lesson on each mathematics concept, so you can look it up together.
Start with tonight's scorecard and one question.