

On this page
When you face a mixed equation like sin x = x/10, algebra alone often falls short. You cannot isolate x using standard trigonometric formulas, and trying to use inverse functions creates an endless loop. Instead, the most reliable way to find the number of solutions is to use a graphical approach.
By treating each side of the equation as a separate function, you can plot them on the same coordinate plane. The points where the two graphs intersect correspond exactly to the solutions of your original equation. This visual method is a staple in JEE and board exam preparation, testing your understanding of function properties, domains, and ranges rather than just your calculation speed.
How do you find the number of solutions of a trigonometric equation by graph?
The general framework for this method involves breaking the equation into two familiar shapes that you know how to draw. For our example, sin x = x/10, we define two separate functions:
y = sin x (a standard, repeating sine wave oscillating endlessly between 1 and −1)
y = x/10 (a straight line passing through the origin with a very shallow, constant slope)
Before you start sketching waves and counting the crossings, you must first establish the physical boundaries where an intersection is even mathematically possible. Because the maximum value of sin x is 1 and the minimum is −1, the straight line y = x/10 can only intersect the sine wave when its y-values also fall perfectly between −1 and 1.
Setting up this absolute boundary gives us the inequality −1 ≤ x/10 ≤ 1, which easily simplifies to −10 ≤ x ≤ 10. Outside this specific domain, the line is either too high (above 1) or too low (below −1) to ever meet the sine curve again. If you struggle to visualise these boundaries in your head, working with the Fermi Simulation Lab can help you experiment with different functions and see how their domains restrict intersections in real time.
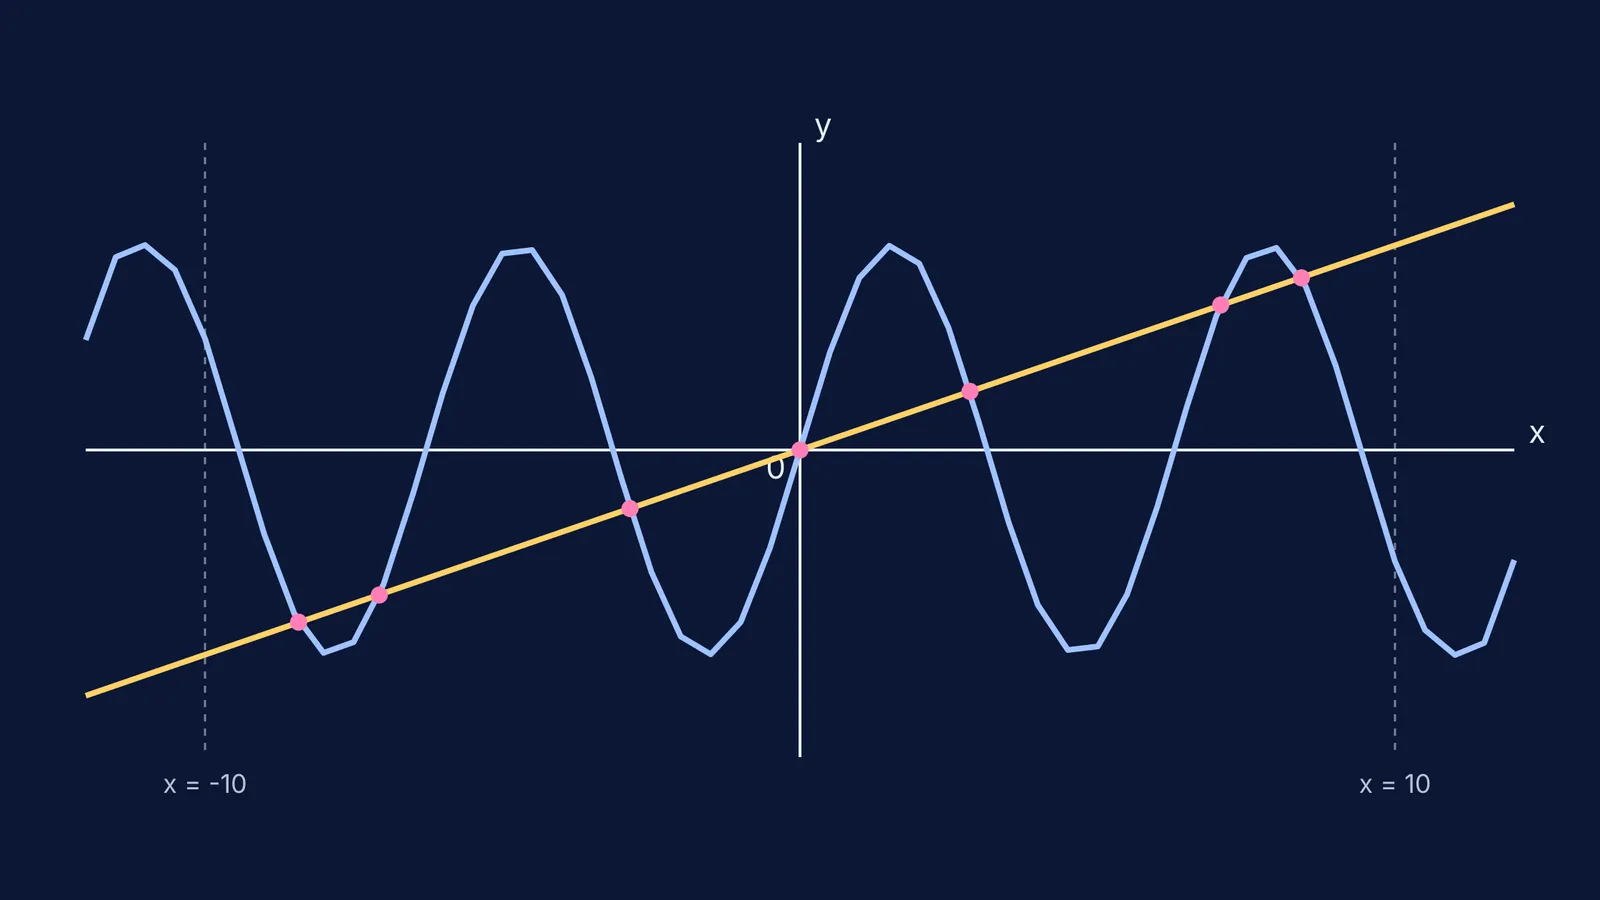
Why does sin x = x/10 have exactly 7 solutions?
Once the strict boundaries of −10 ≤ x ≤ 10 are set, we can trace the curves and count the exact number of intersections. According to a detailed mathematical breakdown on Mathematics Stack Exchange, the equation sin x = x/10 has exactly 7 solutions. We can arrive at this exact number by logically dividing the graph into three clear sections: the origin, the positive side, and the negative side.
First, both y = sin x and y = x/10 pass exactly through the origin. This gives us our first guaranteed solution at x = 0.
Next, we look at the positive x-axis up to x = 10 (which is slightly more than 3π, since π is roughly 3.14 and 3π ≈ 9.42). As x moves to the right, the sine wave completes one full cycle and starts its second. Meanwhile, the straight line climbs very slowly:
Between x = 0 and x = π, the sine wave rises steeply to its peak of 1 and drops back to 0. The line, however, only reaches about 0.314 at x = π. Since the curve rises much faster than the line, it must rise above the line and cross it exactly once before coming back down.
Between x = π and x = 2π, the sine wave dips below zero into negative territory, while the straight line continues to climb steadily into positive territory. They are on opposite sides of the axis, so they cannot cross here.
Between x = 2π and x = 3π, the sine wave completes another positive hump, peaking again at 1. The straight line is around 0.785 at this peak (since the peak is at 2.5π ≈ 7.85). Because 0.785 is less than 1, the straight line cuts directly through this second hump, intersecting the curve twice (once on the way up, and once on the way down).
Adding these distinct crossings up gives exactly three positive solutions.
Finally, we must account for the negative x-axis. Because both sin x and x/10 are what mathematicians call odd functions, their graphs are perfectly symmetric about the origin. Whatever happens on the right side of the y-axis is perfectly mirrored, upside down, on the left side. The three positive intersections we just found mathematically guarantee three corresponding negative intersections.
Adding the three positive solutions, the three negative solutions, and the one crucial intersection at the origin gives a final, exact total of 7 solutions.
How do you check your graphical solutions?
When tackling similar problems involving mixed equations, follow this practical checklist to ensure you do not miss solutions or count crossings that do not exist:
Identify the two distinct functions and sketch their general shapes on the same graph.
Find the absolute maximum and minimum values (the range) of the trigonometric function involved.
Use those vertical bounds to calculate the maximum and minimum x-values for the algebraic function.
Mark the key points on the x-axis, typically multiples of π or π/2, that fall within your newly found boundaries.
Test the y-values of both functions at these key points to see which graph is "on top".
Use algebraic symmetry (checking for odd or even functions) to save time and mirror your results to the other side of the y-axis.
For more on working with mathematical visualisations, see our guide to Inverse of a function: finding it and reflecting the graph or explore Using graphing tools to learn functions and calculus, not to skip them.


