

On this page
Have you ever balanced a marble on top of a smooth bowl, only to watch it roll off at the slightest breath? Conversely, drop that marble into the bowl, and it will settle squarely at the bottom. This physical intuition is exactly what physicists use to predict motion, but they do it using a graph called a potential energy curve.
How to read a potential energy curve?
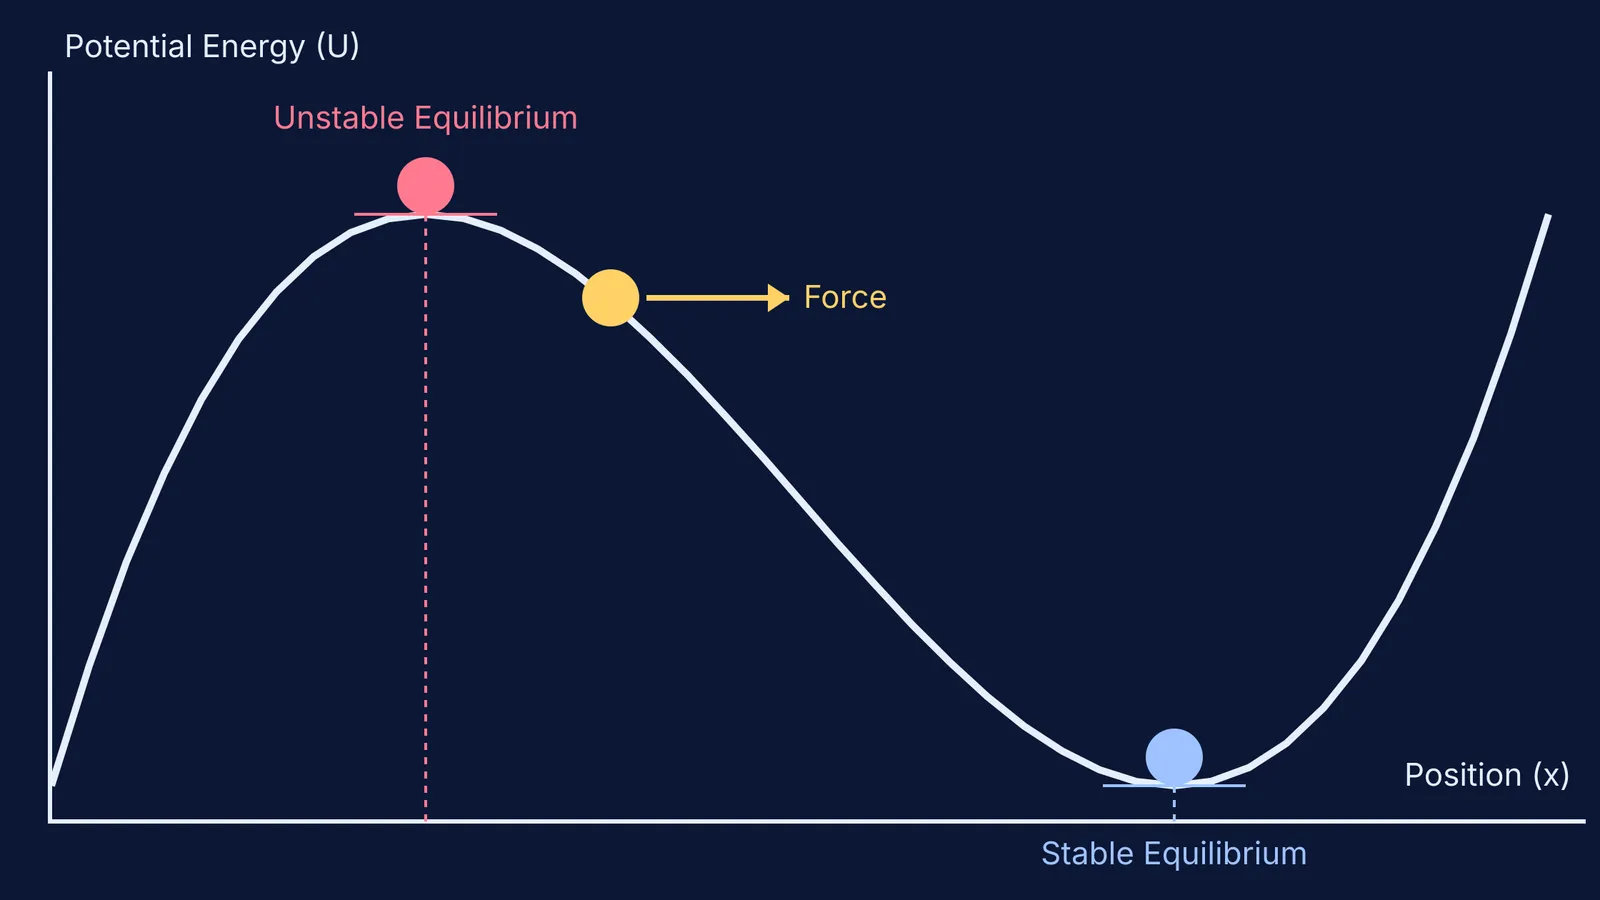
A potential energy diagram graphs the potential energy (U) of a system on the vertical y-axis against its spatial position (x) on the horizontal x-axis. The overall shape of this curve tells you everything you need to know about the forces acting on a particle within that system. According to OpenStax University Physics, the conservative force acting on a particle is exactly the negative slope of the potential energy curve (F = -dU/dx). If the slope is positive, the force pushes the particle in the negative direction, and vice versa. By carefully analysing these slopes, you can predict the exact motion and acceleration of the particle.
This makes Reading physics graphs: slopes, areas and common misreadings a fundamental skill for predicting how a system will behave.
What are stable and unstable equilibrium?
Equilibrium occurs at points where the slope of the potential energy curve is zero. Because the slope is zero, the net force acting on the particle is also zero. But not all equilibrium points act the same way:
Stable Equilibrium: This occurs at a local minimum of the potential energy curve. If you nudge the particle slightly away from this minimum, the slope dictates that a restoring force will push the particle back toward the equilibrium point.
Unstable Equilibrium: This occurs at a local maximum of the curve. If the particle is displaced slightly, the force will push the particle further away from the equilibrium point, just like the marble rolling off the upturned bowl.
Neutral Equilibrium: This happens when the potential energy remains completely constant over a certain region, meaning the net force is perfectly zero regardless of any small displacement you might make.
Another critical feature you will find on these graphs is the turning point. This is the exact position where the particle's kinetic energy drops completely to zero because its total mechanical energy equals the potential energy (E = U). At a turning point, the particle momentarily stops and then reverses its direction of motion, much like a pendulum reaching the highest point of its swing.
How do interactive simulations help you learn?
Reading about a curve gives you the mathematical rules, but seeing the forces respond instantly to a change builds stronger intuition. In a 2008 study published in the journal Science, researchers found that interactive simulations significantly enhance student learning by allowing them to manipulate variables and visualise abstract phenomena.
Predicting where a ball rests and then actively nudging it in a simulation helps you verify your mental models against physical laws. You can explore more about what PhET research says interactive physics simulations are good for.
If you want to test these concepts yourself, you can run and interact with potential energy curves directly in the Fermi Simulation Lab. Here, you can place a virtual particle on a custom curve, give it a nudge, and watch the force vectors update in real-time.


