

On this page
Every year, students preparing for NEET-UG memorize sarcomere diagrams from textbooks, only to stumble on questions about band changes during contraction. A common intuition leads students to assume that because a muscle fiber shortens, all its interior parts must shrink too. Looking passively at static diagrams rarely corrects this error.
Educational research demonstrates why passive watching falls short. In a controlled study published in the *American Journal of Physics*, researchers tested how classroom demonstrations affect conceptual understanding (Crouch et al., 2004). Students who merely watched an instructor demonstrate a physical phenomenon scored 24% on conceptual explanations at the end of the semester—barely different from the 22% scored by students who saw no demonstration at all. While passive observers could identify the outcome 70% of the time (versus 61% without a demo), their grasp of the underlying mechanism showed no significant gain.
In contrast, when students were asked to write down an individual prediction before seeing the demonstration, their conceptual explanation scores rose significantly to 30% (Crouch et al., 2004). Discussing predictions with peers raised scores further to 32%, with 82% correctly identifying the outcome. Committing to a prediction forces you to formulate a clear hypothesis. When an observation contradicts your expectation, the resulting surprise creates cognitive dissonance, prompting genuine mental restructuring. That is why examining simulations vs static diagrams shows that interactive exploration works best when guided by active prediction.
What happens to the A-band, I-band and H-zone during contraction?
To predict band behavior accurately, picture the physical architecture of a sarcomere. The sarcomere is the basic contractile unit of striated muscle, delimited at each end by a dark protein boundary called the Z-disc (or Z-line).
On May 22, 1954, two independent research teams published back-to-back papers in *Nature* demonstrating that muscle filaments slide rather than shrink. Andrew F. Huxley and Rolf Niedergerke used interference microscopy on living frog muscle fibers to show that the dark A-band remains constant in length during contraction and stretch, while the light I-band changes width (Huxley and Niedergerke, 1954). Simultaneously, Hugh E. Huxley and Jean Hanson analyzed isolated myofibrils under phase-contrast and electron microscopy, establishing that thick myosin and thin actin filaments slide past one another without changing length (Huxley and Hanson, 1954).
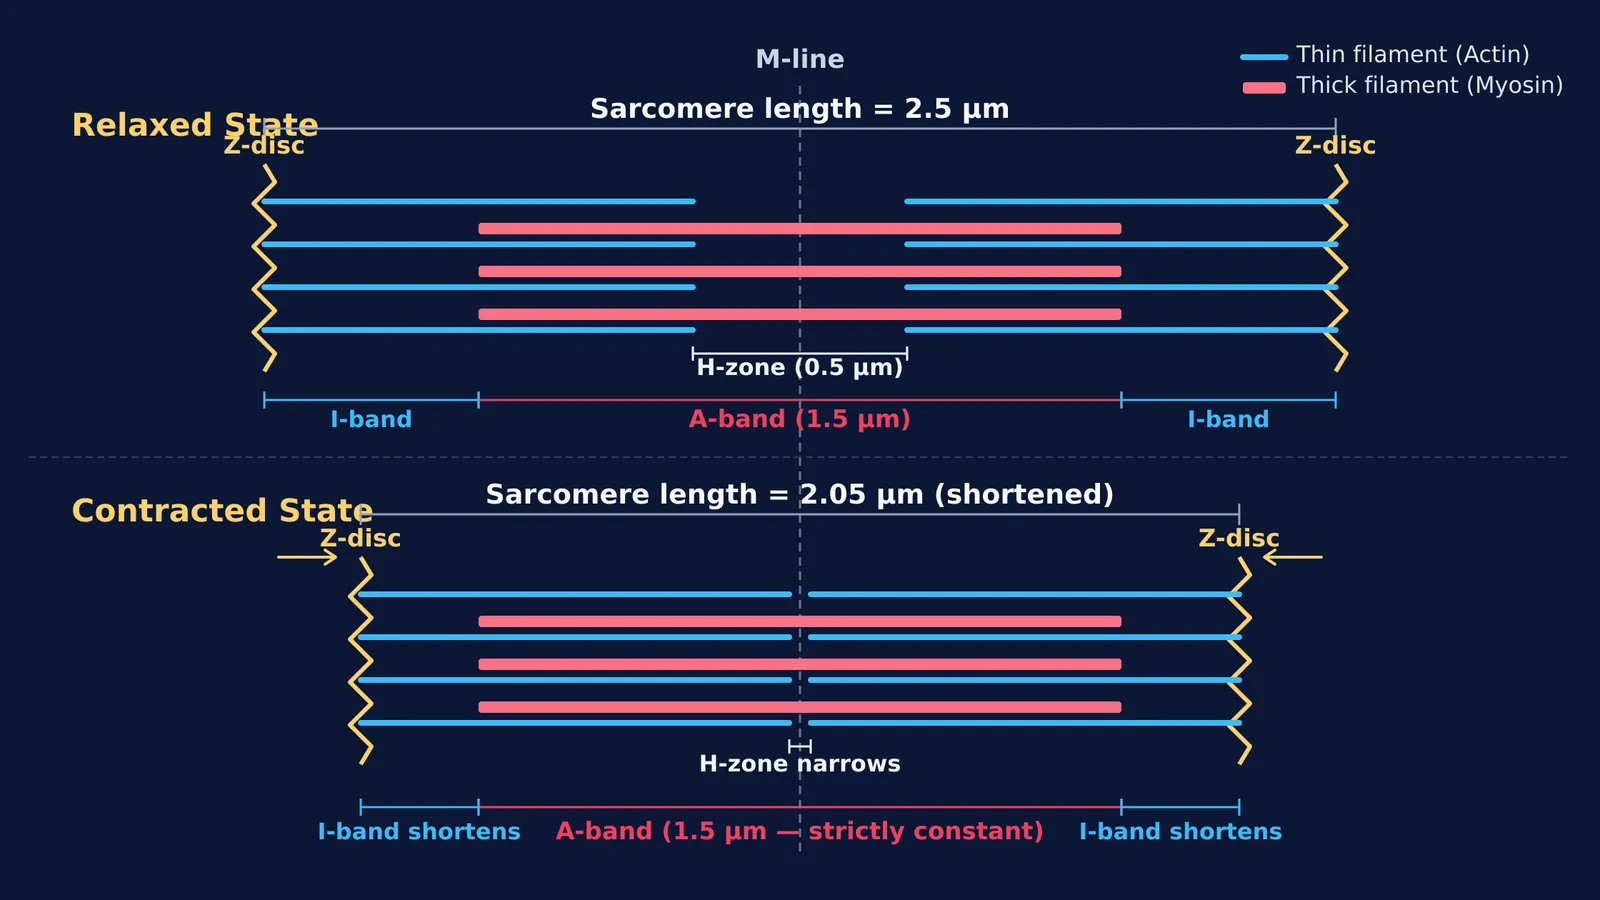
In resting vertebrate muscle, a sarcomere spans approximately 2.5 μm between Z-discs (Huxley and Hanson, 1954). During contraction, each band responds according to its molecular components:
The A-band matches the full length of the thick myosin filaments, measuring approximately 1.5 μm (Huxley and Hanson, 1954). Because myosin filaments never shorten, the A-band length remains strictly constant.
The I-band spans the pale region of thin actin filaments that does not overlap with myosin. As actin slides deeper into the A-band, this non-overlapping zone narrows, so the I-band shortens.
The H-zone is the central gap between thin filaments containing only myosin. As actin filaments advance toward the central M-line, this gap shrinks or disappears.
The Z-discs are pulled toward each other, shortening the overall sarcomere.
How can you test your predictions with an interactive simulation?
Before moving any controls, write down your prediction for four quantities: sarcomere length, A-band width, I-band width, and H-zone width. Then test your predictions against an interactive model.
In the Fermi Simulation Lab, which provides interactive simulations for ideas that are easier to see than to read, you can slide the sarcomere contraction control to watch the filaments interact:
Check the thick myosin filaments: their width remains fixed, keeping the A-band unchanged.
Track the thin actin filaments: they slide inward toward the M-line without altering their individual lengths.
Observe the gaps: the I-band narrows on both ends, while the central H-zone shrinks until actin ends meet.
If you want to connect this physical sliding mechanism to calcium signaling and cross-bridge cycling, the Fermi Concept Library covers every concept in physics, chemistry, biology, mathematics and computing, each with its own lesson and its place in the map, alongside muscle contraction step by step. When you encounter gaps in your understanding, Fermi's AI tutor can work out what you already know, run the simulation, and check your reasoning as you work.
What is a reliable three-step framework for muscle contraction questions?
When solving exam questions on sarcomere changes, follow this systematic method:
Identify the invariants: The A-band, thick filament length, and thin filament length never change. Eliminate options claiming the A-band shortens.
Track the boundaries: Both Z-discs pull inward toward the M-line, decreasing sarcomere length.
Compute the variable bands: Sarcomere shortening equals the combined reduction in the I-band and H-zone. This relationship resolves questions on sliding filaments and band-length sums.
Using a predict-observe-verify cycle replaces rote memorization with a clear physical model that endures under exam pressure.


