

On this page
What is the chemistry of marble reacting with acid?
When calcium carbonate (CaCO₃) meets dilute hydrochloric acid (HCl), it breaks down to form calcium chloride, water, and carbon dioxide gas. This reaction is a staple of chemistry labs because the escaping gas lets you easily track the reaction rate. You can measure the volume of carbon dioxide in a gas syringe, or put the flask on a balance to record the mass lost as the gas floats away.
If you choose the gas syringe method, you seal the flask with a bung the moment you mix the reactants, ensuring no gas escapes into the room. The expanding carbon dioxide pushes the plunger outwards, and you read the volume at regular time intervals (for example, every ten seconds). If you prefer the mass loss method, you place the unstoppered flask on a digital balance. As the heavy carbon dioxide gas leaves the flask, the total mass steadily drops. Both methods give you the data you need to plot a smooth curve and compare the reaction speeds.
Why does marble powder react faster than marble chips?
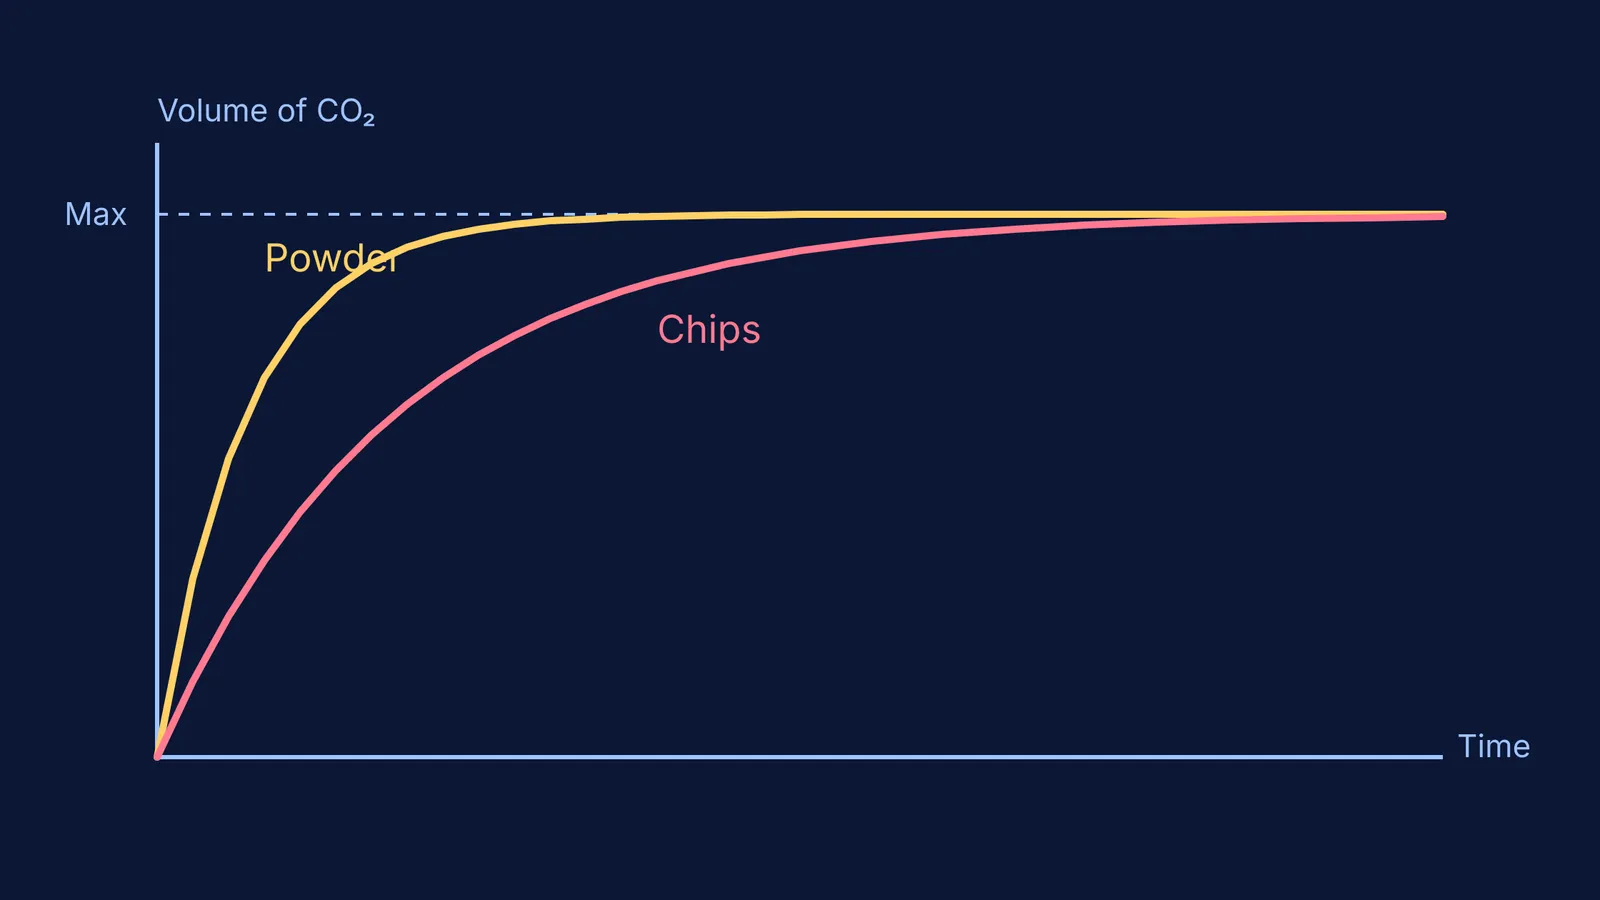
If you run the experiment twice—once with large marble chips and once with fine marble powder of the exact same mass—the powder will produce a much steeper curve on your volume-time graph. A powdered solid will normally produce a faster reaction because the powder has a significantly greater surface area than a single lump.
This difference comes down to collision theory. For the acid to react with the marble, the hydrogen ions in the acid must physically bump into the calcium carbonate particles with sufficient energy. In a large marble chip, the acid can only reach the molecules on the solid's outer boundary. The molecules locked inside the chip have to wait until the outer layers dissolve.
By crushing the chips into a fine powder, you expose many new particles to the acid all at once. This drastically increases the frequency of collisions. More collisions per second directly translate to a faster rate of reaction.
How do you read the reaction rate from a graph?
If you plot the volume of carbon dioxide over time, you can see the speed of the reaction in the gradient of the curve. The steeper the line, the faster the reaction is proceeding at that exact moment.
The curve for the powder rises sharply from the start, showing a rapid release of gas as maximum surface area meets fresh acid.
The curve for the chips climbs more gently, indicating a slower, steadier reaction limited by the exposed surface.
Both curves eventually level out at the exact same height (a horizontal plateau) when all the calcium carbonate has been consumed. The powder simply reaches that plateau much sooner.
If you are trying to picture how particles bounce into each other or want to test how changing sizes alters the collision frequency, the Fermi Simulation Lab provides interactive simulations for the ideas that are easier to see than to read. You can watch these microscopic changes play out in real time.
For more on how rates are measured and modelled, read about how to interpret integrated rate law graphs to find the order of a reaction. You can also explore how heat drives collisions by checking the temperature coefficient of a rate, or see how to predict the direction of a reversible process using the reaction quotient.


