

On this page
Much of the machine learning you hear about learns from labelled examples, such as emails tagged spam. Clustering asks a stranger question. If nobody gives you any labels, can a computer still find groups in the data?
What is clustering in machine learning?
Google's machine learning course puts it in one line: clustering is an unsupervised machine learning technique designed to group unlabeled examples based on their similarity to each other. Unsupervised means there is no answer key. The same page lists uses such as market segmentation, grouping search results, medical imaging and anomaly detection.
Compare that with a decision tree you build on paper, which needs every example labelled before it can learn a rule. A clustering method gets only the points.
The usual starter method is k-means. The scikit-learn user guide notes that k-means is often called Lloyd's algorithm. The name refers to S. Lloyd, author of Least squares quantization in PCM, published in IEEE Transactions on Information Theory in 1982. It has three steps: choose k starting centres, assign each point to its nearest centre, then move each centre to the mean of its points. Repeat the last two steps until the centres stop moving.
How do you do k-means clustering by hand?
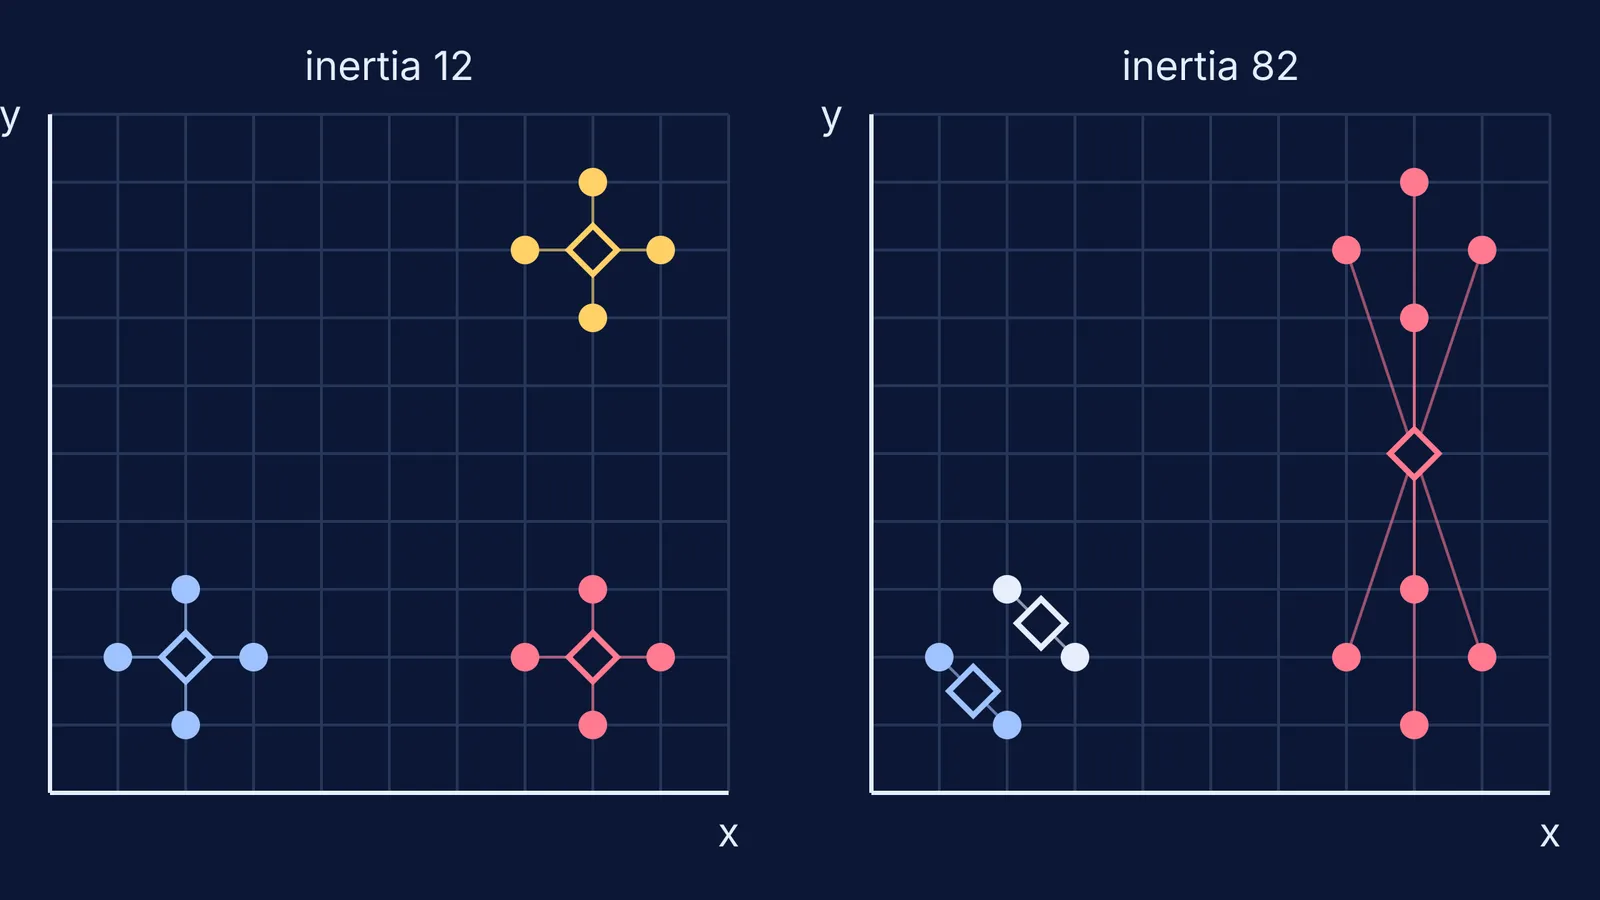
Plot these 12 points: (1,2), (2,1), (2,3), (3,2), (7,8), (8,7), (8,9), (9,8), (7,2), (8,1), (8,3), (9,2).
Choose k = 3 and mark three starting centres at (1,2), (7,8) and (9,2).
Assign. For each point, find the nearest centre and colour the point to match. You can skip the square root and compare (change in x)² + (change in y)². For (9,8), the centre (7,8) gives 4 and (9,2) gives 36, so it joins the (7,8) group.
Update. Move each centre to the average of its points. The bottom-left group (1,2), (2,1), (2,3), (3,2) has mean ((1+2+2+3)/4, (2+1+3+2)/4) = (2,2). The other two centres move to (8,8) and (8,2).
Repeat steps 3 and 4. No point changes colour, so you are done after two rounds.
To score the result, add up the squared distance from each point to its own centre. The scikit-learn guide calls this the inertia, or within-cluster sum of squares, and k-means tries to make it as small as possible. Every point here sits exactly 1 unit from its centre, so the inertia is 12.
Where does k-means go wrong?
Rub out the centres and start again from (1,2), (2,3) and (8,5).
Round 1: (1,2) and (2,1) join the first centre, (2,3) and (3,2) join the second, and all eight points on the right join (8,5).
Update: the centres move to (1.5,1.5), (2.5,2.5) and (8,5).
Round 2: no point changes colour, so the method stops.
It has split the bottom-left blob in two and merged the other two blobs into one. The inertia is 82, against 12 for the good answer, yet the algorithm sees no reason to move.
The scikit-learn guide warns that, given enough time, k-means always converges, but possibly to a local minimum that depends heavily on the starting centres. So it is often run several times from different starts, and scikit-learn offers the k-means++ scheme, which places the starting centres generally far apart. Google's page on the advantages and disadvantages of k-means lists the other traps:
You must choose k yourself.
Results depend on the starting values.
It struggles with clusters of different sizes and densities.
Outliers can drag a centre away, or end up with a cluster of their own.
In many dimensions, distances between points start to look alike.
scikit-learn adds that inertia assumes convex, roughly round clusters and responds poorly to long, stretched shapes.
How do you choose the number of clusters?
Use the same 12 points and work out the inertia for different values of k:
k = 1: one centre at (6,4), inertia 204.
k = 2: one blob alone and the other two merged, inertia 84.
k = 3: inertia 12.
k = 4: one blob split into two pairs, inertia 10.
The drop from 84 to 12 is large; the drop from 12 to 10 is small. That bend suggests k = 3. The best inertia never rises as k grows (12 centres give 0), so it cannot choose k on its own.
What should you try next?
Try these on paper:
Move one point far away, say to (20,20), and see which centre gets pulled towards it.
Plot two long, thin diagonal stripes and check whether k-means cuts across them.
Ask what the groups mean. The method found three blobs; only a person can say whether they are three kinds of shoppers, plants or stars.
If the mean of a set of points or the distance formula feels shaky, the Fermi Concept Library has a lesson for every concept in mathematics and computing. You can also bring the grid to Fermi's AI tutor, which works out what you already know and builds a plan for the session.
For the supervised side, try fitting a line to marks and study hours with Class 11 maths, and see where both sit in AI vs machine learning vs deep learning.


