

On this page
Your pulse is a free data logger. In one PE period or biology practical you can record it at rest, straight after exercise and through five minutes of recovery, then graph it. Predict the shape first, then compare classmates without simply rewarding whoever has the lowest resting pulse.
How quickly does heart rate recover after exercise?
It falls fastest in the first minute, then more and more slowly. A 2013 paper by Pierpont, Adabag and Yannopoulos explains why (Annals of Noninvasive Electrocardiology, 2013). Right after you stop, the heart slows mainly because parasympathetic (vagus nerve) activity switches back on; the sympathetic "speed up" signals fade more slowly and matter much more after hard exercise. A simple exponential decay describes recovery from low-level exercise well, while recovery from hard exercise is more complex and may not reach baseline within five minutes.
Heart-rate recovery is usually measured as the fall from peak heart rate to the rate one or two minutes after stopping.
Fitness shows up in that early part. Imai and colleagues measured how fast heart rate fell in the first 30 seconds after exercise: it fell significantly faster in 9 trained cross-country skiers, and more slowly in 20 patients with chronic heart failure, than in healthy people of the same age (Journal of the American College of Cardiology, 1994).
In 1999, Cole and colleagues followed 2,428 adults for six years after an exercise test and called a fall of 12 beats per minute or less in the first minute abnormal; that low value strongly predicted death (New England Journal of Medicine, 1999). These were patients sent for diagnostic heart tests, averaging 57 years old, so that cut-off is not a classroom test.
How do you take your pulse accurately?
The British Heart Foundation says to sit or lie down for five minutes and avoid caffeine first, then press your fingers on the inside of your wrist at the base of your thumb, count for 30 seconds and double it (British Heart Foundation). It gives a normal adult resting rate as 60 to 100 beats per minute (BHF).
Work in pairs: one person exercises, the other counts and writes.
Resting: sit quietly for five minutes, count for 30 seconds and double it.
Exercise: step up and down on a low, stable step for three minutes, in time with a metronome app, so everyone does the same work.
Peak: the moment you stop, sit down. Your partner counts for 15 seconds and multiplies by 4.
Recovery: repeat the 15-second count at 1, 2, 3, 4 and 5 minutes.
Why 15 seconds? The rate is falling fast, and a 30-second count would average a moving number. The cost: one missed beat in 15 seconds is an error of 4 beats per minute. A fitness band works too; just note which method each person used.
What shape will the recovery graph be?
Before measuring, draw empty axes (heart rate against minutes after stopping) and predict:
Where the curve starts, and which level it heads towards.
Whether minute one's drop is bigger than minute two's.
Whether you will be back at resting by minute five.
A simple model is HR = resting + (peak − resting) × e^(−t/τ), where τ (tau) is the time constant: the smaller it is, the faster you recover. Each minute closes the same fraction of the gap, not the same number of beats, so the curve flattens out. Our guide to exponential growth and decay with dy/dt = ky builds this model step by step. Exponential curves are easier to see than to read about; the Fermi Simulation Lab has interactive simulations for ideas like this.
How do you compare classmates' fitness fairly?
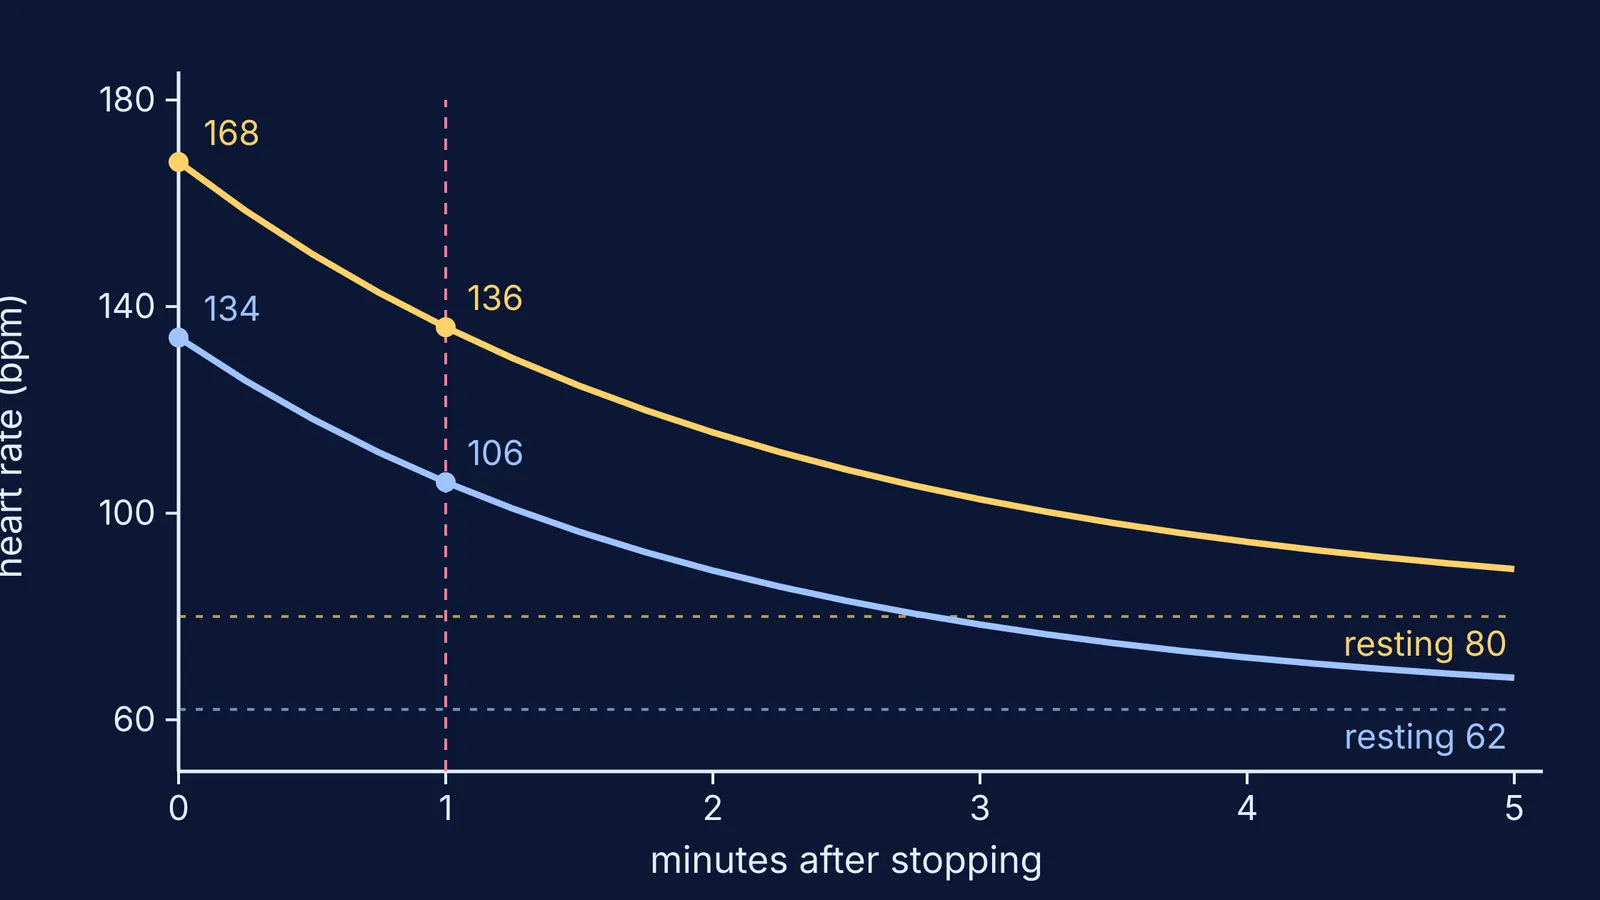
A worked example with made-up numbers, drawn in the graph at the top:
Kabir: resting 80, peak 168, one minute after stopping 136. Drop: 32 beats per minute.
Meera: resting 62, peak 134, one minute after stopping 106. Drop: 28 beats per minute.
By raw drop, Kabir wins. But his rate rose 88 beats above resting and Meera's only 72, so he had a bigger gap to close. A fairer measure is the fraction of the gap closed in the first minute:
Kabir: 32 ÷ 88 = 36%
Meera: 28 ÷ 72 = 39%
One miscounted beat shifts either result by about 5 percentage points, so this is a tie. Their time constants, from τ = 60 ÷ ln(starting gap ÷ gap after one minute), are about 133 and 122 seconds: close again.
To link the curve to the heart itself, see our notes on the cardiac cycle and circulation. If the maths is the sticking point, Fermi's AI tutor can work out what you already know and build a plan for the session.
Plot your class's curves on one set of axes and see whose prediction came closest.


