On this page
When a gas comes into contact with a solid surface, molecules stick to it. This process, called adsorption, is the science behind gas masks, water filters and industrial catalysts. It involves gas molecules attaching to a surface, distinct from Henry's law and the solubility of gases dissolving into a liquid. Absorption means a substance is drawn deep inside another material's bulk volume, but adsorption means the molecules gather strictly on the outer boundary. But how much gas actually sticks?
The Freundlich adsorption isotherm is an empirical equation used to predict the mass of gas adsorbed per unit mass of a solid (x/m) as the equilibrium pressure (P) increases (Wikipedia). The model works beautifully for many situations, but it has a built-in mathematical flaw: it assumes the gas will keep sticking indefinitely.
Here is how the Freundlich adsorption isotherm works, how to test it, and why the real-world curve eventually levels off.
What is the Freundlich adsorption isotherm?
The Freundlich isotherm is an empirical relationship, meaning it fits experimental data rather than deriving from a theoretical mechanism. The mathematical expression for gas-phase adsorption is:
x/m = K P^(1/n)
In this equation:
x is the mass of the gas adsorbed.
m is the mass of the solid adsorbent.
P is the equilibrium pressure of the gas.
K is the distribution coefficient, and n is a correction factor. Both are constants that depend on the nature of the gas, the solid surface and the temperature.
To find the constants from an experiment, you can linearize the equation by taking the logarithm of both sides:
log(x/m) = log(K) + (1/n) log(P)
If you plot log(x/m) on the y-axis against log(P) on the x-axis, you get a straight line. The y-intercept gives you log(K), and the slope of the line is 1/n.
Why does the adsorption curve level off at high pressure?
The value of 1/n tells you how adsorption responds to pressure. At low pressures, 1/n is often close to 1, meaning adsorption rises directly in proportion to pressure. At intermediate pressures, it becomes a fraction, and the curve starts to bend.
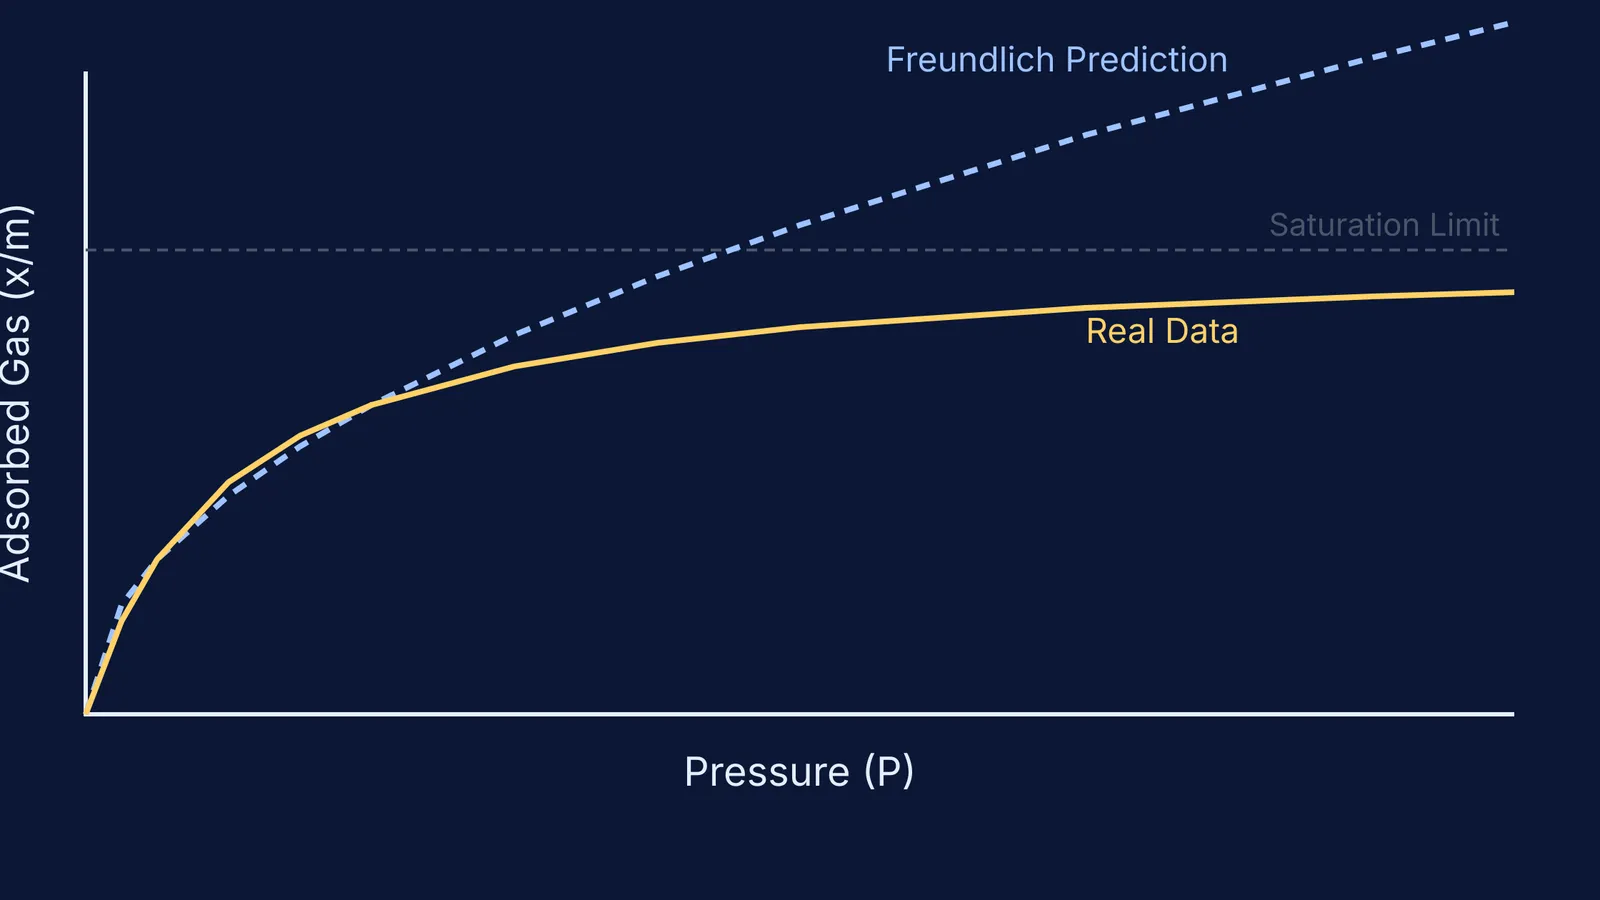
But at high pressures, the Freundlich equation breaks down.
Mathematically, the term K P^(1/n) will always keep growing as P grows. But physically, a solid only has a finite surface area. Once every "seat" on the solid surface is occupied by a gas molecule, the surface is saturated. Pumping more gas into the container and increasing the pressure will not force more molecules to stick, because there is nowhere left for them to go.
In a real experiment, the adsorption curve levels off into a flat, horizontal line at saturation pressure (Wikipedia). The Freundlich equation cannot predict this flat plateau.
How to test the Freundlich adsorption isotherm simulation?
You do not need a physical chemistry laboratory to see where the math diverges from reality. You can set up a virtual experiment in the Fermi Simulation Lab to see the curve break away.
Start at low pressure: Run the simulation with low pressure values and plot your results for x/m versus P. You will see the curve rising exactly as the Freundlich equation predicts.
Find the constants: Take the logarithm of your data points and plot log(x/m) against log(P). Use the straight line to calculate K and n.
Crank up the pressure: Push the pressure in the simulation well past standard conditions. Watch what happens to the real data curve.
When should you use the Langmuir isotherm instead?
Because of the high-pressure failure, scientists often turn to the Langmuir adsorption isotherm instead. Unlike Freundlich, the Langmuir model has a mathematical term explicitly designed to handle saturation, ensuring the curve naturally levels off at high pressures. It imagines the solid surface as a grid of distinct adsorption sites, where each site can hold exactly one molecule. Once all the sites are full, no more gas can stick.
If you are dealing with low or intermediate pressures, the Freundlich model is an excellent tool because its math is simple to work with. But if your system involves high pressures, much like dealing with real gases and the van der Waals equation, the simple ideal model breaks down and you must factor in the physical limits of the molecules.