

On this page
The filament bulb is a classic Class 12 example of a device that breaks Ohm's law, but its curved graph is often memorised rather than understood. Here you will build a bulb and a fixed resistor in a free simulation, predict the shape first, and connect the bend to temperature using real numbers for tungsten.
Why is a filament bulb not ohmic?
A device is ohmic when the current through it is proportional to the voltage across it, so its I-V graph is a straight line through the origin. The NCERT Class 12 Physics chapter on current electricity (section 3.6) lists the first kind of deviation from Ohm's law as V ceasing to be proportional to I.
The same chapter explains why (section 3.8): as a metal gets hotter, its electrons collide more often, so resistivity goes up. Over a limited temperature range NCERT gives ρ = ρ₀[1 + α(T − T₀)], with α positive for metals.
A bulb heats itself: more voltage means more power, a hotter filament and more resistance. In a tungsten table compiled by The Physics Factbook from Texas Christian University lab data, resistivity is 5.65 μΩ·cm at 300 K, 24.93 μΩ·cm at 1,000 K and 73.91 μΩ·cm at 2,500 K. That is a rise of about 13 times between room temperature and a glowing filament.
A fixed resistor keeps a near-constant resistance, so its graph stays straight. For other devices that break the rule, see our explainer on non-ohmic devices in Class 12 physics.
What does the I-V graph of a filament bulb look like?
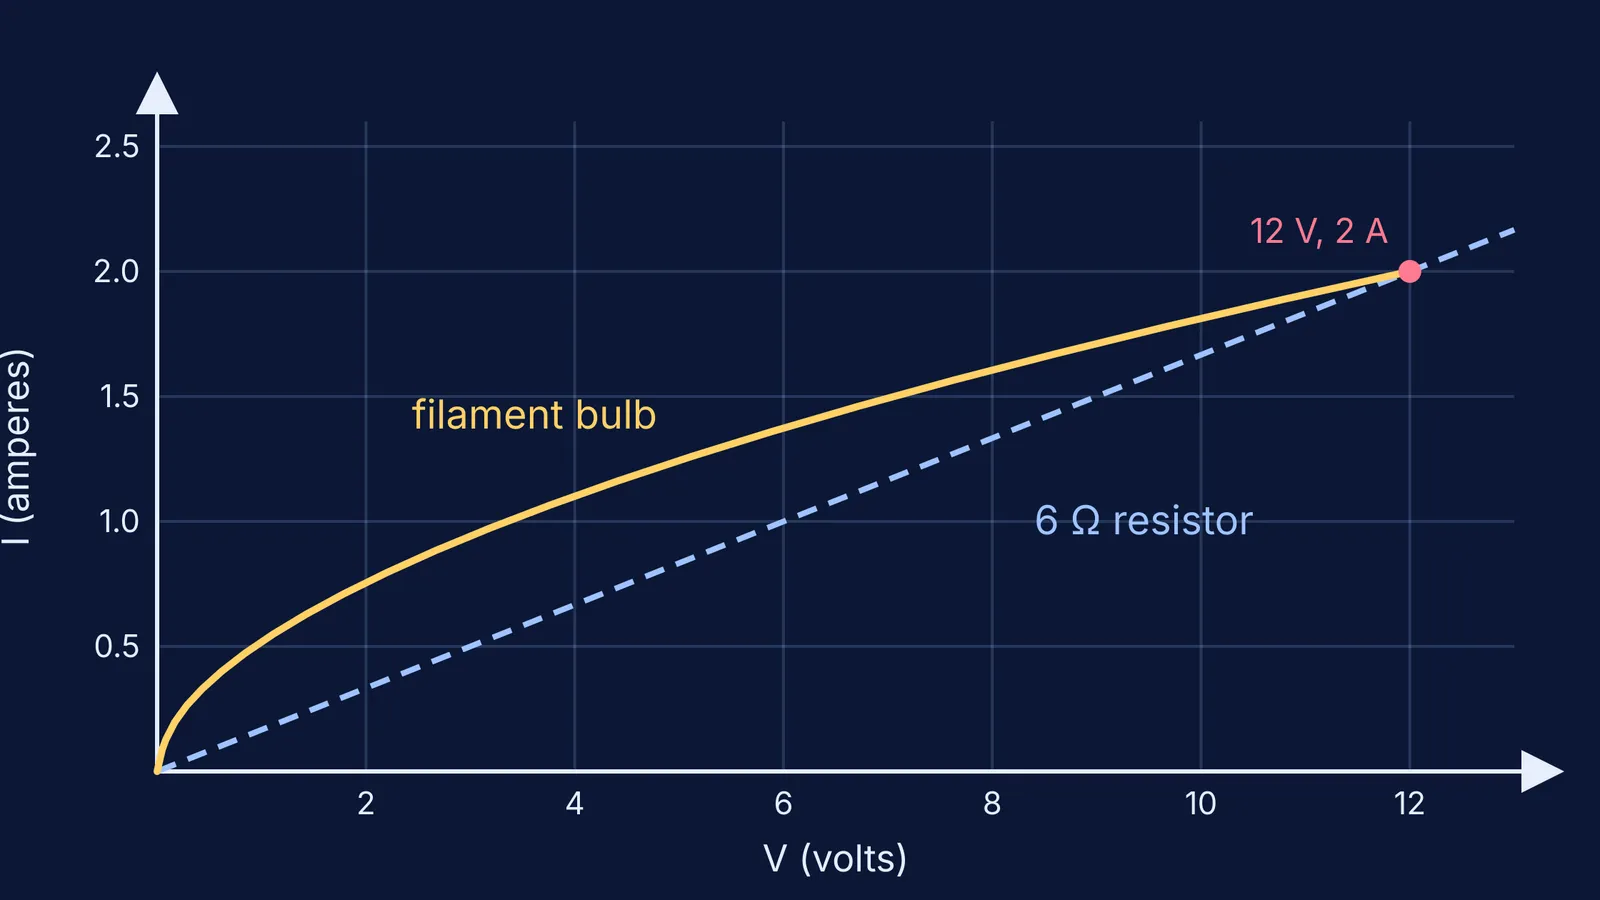
With current on the vertical axis, the bulb's curve starts steep near the origin, where the cold filament has low resistance, then bends towards the voltage axis as it heats up.
Watch the axes. NCERT's Figure 3.5 in the same chapter shows a conductor departing from Ohm's law with V on the vertical axis, so its curve bends upwards. A bulb's V-I graph also bends upwards, which is an easy exam trap.
A worked example with real tungsten data
Take a 12 V bulb that draws 2 A when lit, so its hot resistance is 12 ÷ 2 = 6 Ω. Assume the filament runs at 2,500 K at 12 V and that it loses heat only by radiation, which grows with the fourth power of temperature. Scaling the resistance with the tungsten table from The Physics Factbook gives these model points:
300 K (cold): resistance 6 × 5.65 ÷ 73.91 ≈ 0.46 Ω
1,000 K: about 1.1 V, 0.55 A, 2.0 Ω
1,500 K: about 3.2 V, 0.97 A, 3.3 Ω
2,000 K: about 6.7 V, 1.46 A, 4.6 Ω
2,500 K: 12 V, 2 A, 6 Ω
A fixed 6 Ω resistor's line meets this curve only at the origin and at 12 V. Below 12 V, the cooler bulb has lower resistance, so it carries more current than the resistor.
How do you plot a bulb's I-V curve in a simulation?
The free PhET Circuit Construction Kit: DC uses ohmic bulbs by default. Its teacher guide says a non-ohmic bulb appears on the Lab screen when you tick "Add Real Bulbs". It also gives a link to the Lab screen with real bulbs on.
Build a loop with a battery, a real bulb and an ammeter in series, with the voltmeter across the bulb.
Sketch your prediction first: where is the curve steepest, and where does it flatten?
Tap the battery to change its voltage. Record V and I at eight to ten settings, several of them near zero.
Work out R = V ÷ I for each row.
Swap the bulb for a resistor and repeat.
Plot both sets on one graph, current on the vertical axis.
Our guide to testing five DC circuit misconceptions in a simulation walks through the basics.
Where does the curve bend, and how do you predict it?
Check three things on your graph.
Steepest near zero. The cold filament has its lowest resistance. In the worked example, based on the tungsten resistivity table, resistance more than quadruples by about 1.1 V.
Flatter at high voltage. Each extra volt heats the filament further, so current grows more slowly.
Crossing point. The resistor line crosses the bulb's curve where the two resistances are equal, at the rated voltage if you match the bulb's hot resistance.
The simulation's bulb model may not match tungsten exactly, so judge the shape and the trend in V ÷ I, not the exact values. To practise the α formula, try our worked examples on the temperature coefficient of resistance.
For more ideas that are easier to see than to read, try the interactive simulations in the Fermi Simulation Lab. When you are not sure where to start on current electricity, Fermi's AI tutor can work out what you already know and build a plan for the session.


