On this page
Imagine a town of 10,000 people where 10 wake up infectious. Does the infection burn through the town, or fizzle out? Three boxes can tell you. William Kermack and A. G. McKendrick set out the idea in 1927 in A contribution to the mathematical theory of epidemics, asking whether an epidemic can stop while many susceptible people remain.
How does the SIR model spread an infection through a town?
The SIR model sorts everyone into three groups: Susceptible (can catch it), Infectious (can pass it on) and Recovered (immune, out of the chain). The Institute for Disease Modeling's SIR guide writes the rules as dS/dt = −βSI/N, dI/dt = βSI/N − γI and dR/dt = γI.
β is the transmission rate: contacts per day times the chance each contact passes the infection on.
γ is the recovery rate, 1 divided by the average number of days a person stays infectious.
R₀ = β/γ is the average number of people one case infects in a fully susceptible town; the disease spreads when R₀ is above 1 and dies out below 1.
Say each infectious person has 10 close contacts a day, each contact has a 4% chance of infection, and people stay infectious for 7.5 days. Then R₀ = 10 × 0.04 × 7.5 = 3.
What sets the peak: contact rate or vaccination rate?
Rearrange the middle IDM equation to dI/dt = γI(R₀ × S/N − 1). Infections grow only while S/N is above 1/R₀, and peak when it falls to 1/R₀.
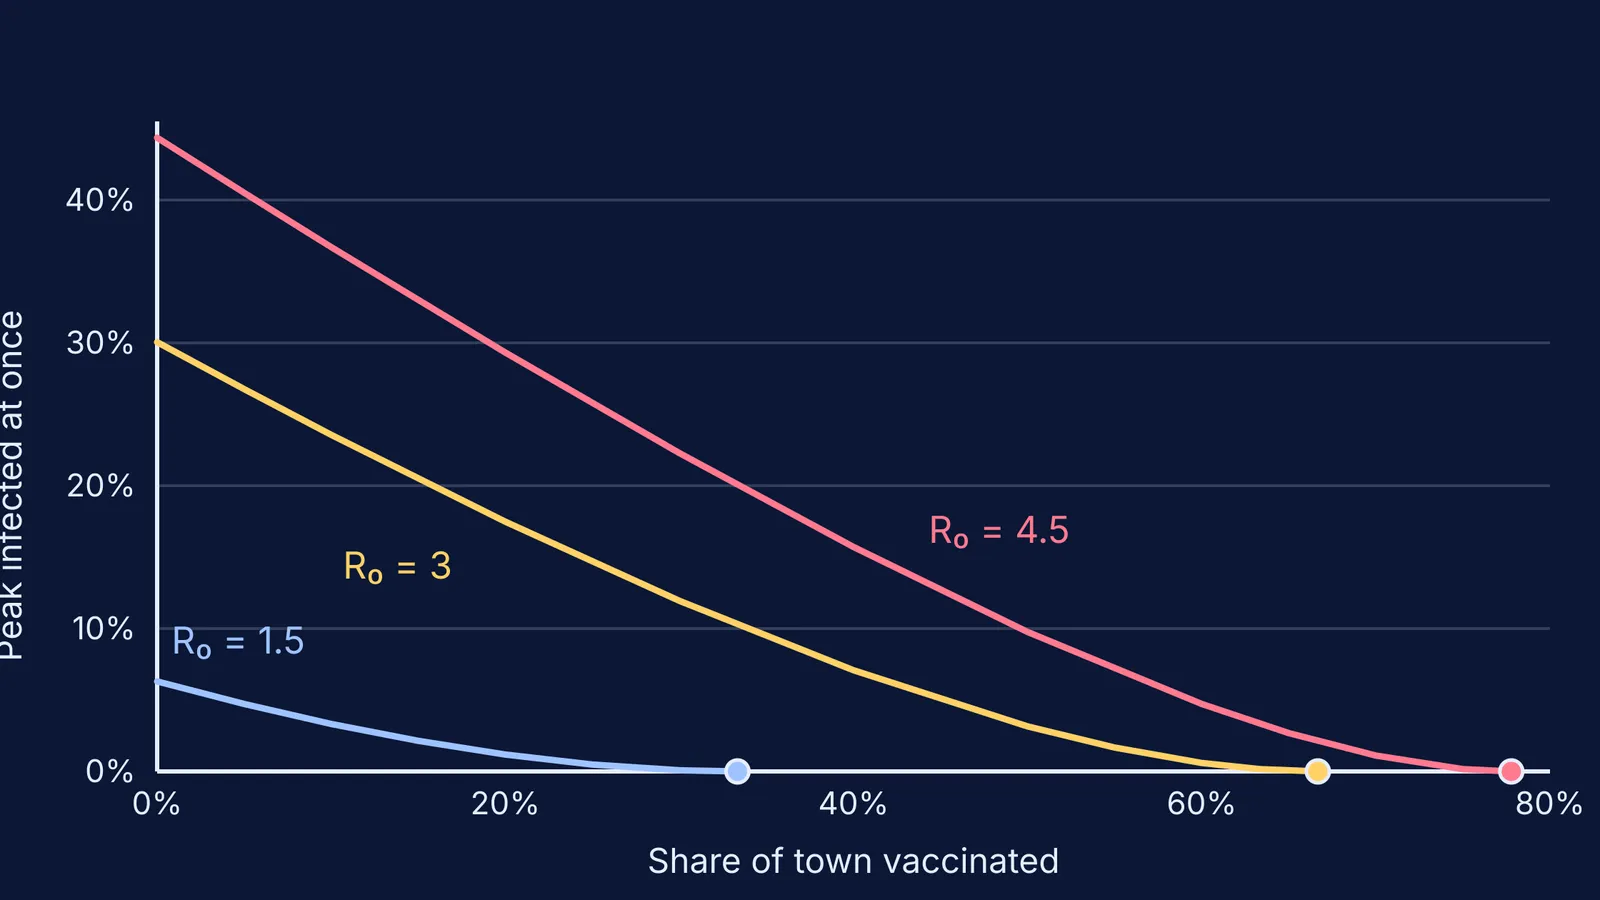
We solved the equations for our R₀ = 3 town, with vaccinated people starting as Recovered:
0% vaccinated: about 30% of the town is infected at once at the peak, and about 94% catch it by the end.
20% vaccinated: peak about 17%, total about 70%.
40% vaccinated: peak about 7%, total about 44%.
60% vaccinated: peak under 1%, total about 13%.
Now change contacts instead. At 5 a day (R₀ = 1.5) the peak falls to about 6%, but about 58% of the town is still infected by the end. At 15 a day (R₀ = 4.5) the peak jumps to about 44%.
How does herd immunity stop an outbreak?
WHO defines herd immunity, also called population immunity, as "the indirect protection from an infectious disease that happens when a population is immune either through vaccination or immunity developed through previous infection" (WHO Q&A on herd immunity). Vaccination itself goes back to Edward Jenner and smallpox.
If a share p of the town is immune, each case infects R₀ × (1 − p) people on average. Push that below 1 and you get the herd immunity threshold, 1 − 1/R₀, as used in Pedro Plans-Rubió's 2020 analysis in Vaccines.
R₀ = 1.5: threshold 33%.
R₀ = 3: threshold 67%.
R₀ = 4.5: threshold 78%.
At 70% vaccinated in our R₀ = 3 town, each case infects 0.9 others, so the 10 starting cases lead to roughly 10 ÷ (1 − 0.9) = 100 cases in total, not thousands.
Vaccines are not perfect, so the same paper divides the threshold by vaccine effectiveness. With R₀ = 3 and a 90% effective vaccine, you need about 74% vaccinated.
Why does measles need about 95% vaccination?
The WHO measles fact sheet says one person with measles can infect up to 18 others. Put R₀ = 18 into 1 − 1/R₀ and you get about 94%.
That matches WHO's figure: herd immunity against measles needs about 95% of a population vaccinated, while for polio the threshold is about 80% (WHO Q&A). Plans-Rubió found that 95% two-dose coverage would not be enough for measles viruses with R₀ of 10 or more, assuming 95% vaccine effectiveness.
The model assumes even mixing, so a low-coverage school can host an outbreak even when the city average looks safe.
How can you run this simulation yourself?
A spreadsheet can step the IDM equations one day at a time:
Make columns for day, S, I and R. Start with S = 9,990, I = 10, R = 0, β = 0.4 and γ = 1/7.5.
Each row: new infections = β × S × I ÷ 10,000; new recoveries = γ × I. Move them between boxes.
Write down your guess for the peak at 0%, 20%, 40% and 60% vaccinated (move that share of S into R at the start), then run it. Daily steps give answers close to ours, not identical.
Raise vaccination 5 points at a time until I never climbs above 10. The first value that works should be 70%, just above the 67% threshold.
Halve β to 0.2 and repeat. The threshold drops to about 33%.
If you prefer code, use the loop from our guide to writing your own physics simulation in Python. For when a moving model beats a picture, see simulations or static diagrams: what studies found.
If dI/dt is new to you, the Fermi Concept Library has a lesson for every concept in mathematics and biology. The same predict-then-run habit works for physics in the Fermi Simulation Lab, which has interactive simulations for ideas that are easier to see than to read.