

On this page
Tilt an old CD under a light and a rainbow slides across it. The colours come from the shape of the surface: a spiral track wound so tightly that the disc behaves like a diffraction grating. Once you know the spacing, one equation predicts where each colour appears.
Why does a CD show rainbow colours?
OpenStax's University Physics chapter on diffraction gratings describes a diffraction grating as a large number of precisely positioned parallel lines, with the regions between them acting like slits. On a CD the lines are neighbouring turns of the data spiral. The ECMA-130 standard for CD-ROM (clause 11.3) sets the pitch of that spiral at 1.6 µm ± 0.1 µm. That works out to about 625 tracks in every millimetre.
Light reflecting from each turn of the track spreads out as a small wave. In most directions those waves arrive out of step and cancel. Where the path difference between neighbouring tracks is a whole number of wavelengths, they add up into a bright beam. That direction depends on wavelength, so each colour leaves the disc at its own angle.
How do you calculate the angle of each colour?
The bright directions follow the grating equation, d sin θ = mλ, where d is the line spacing, θ the angle from the normal, m the order (0, ±1, ±2 and so on) and λ the wavelength, as set out by OpenStax. OpenStax's worked example takes visible light as running from 380 nm (violet) to 760 nm (red).
Here is the worked example for a CD lit straight on, with d = 1600 nm:
m = 0: θ = 0 for every colour, so the straight-back reflection stays white.
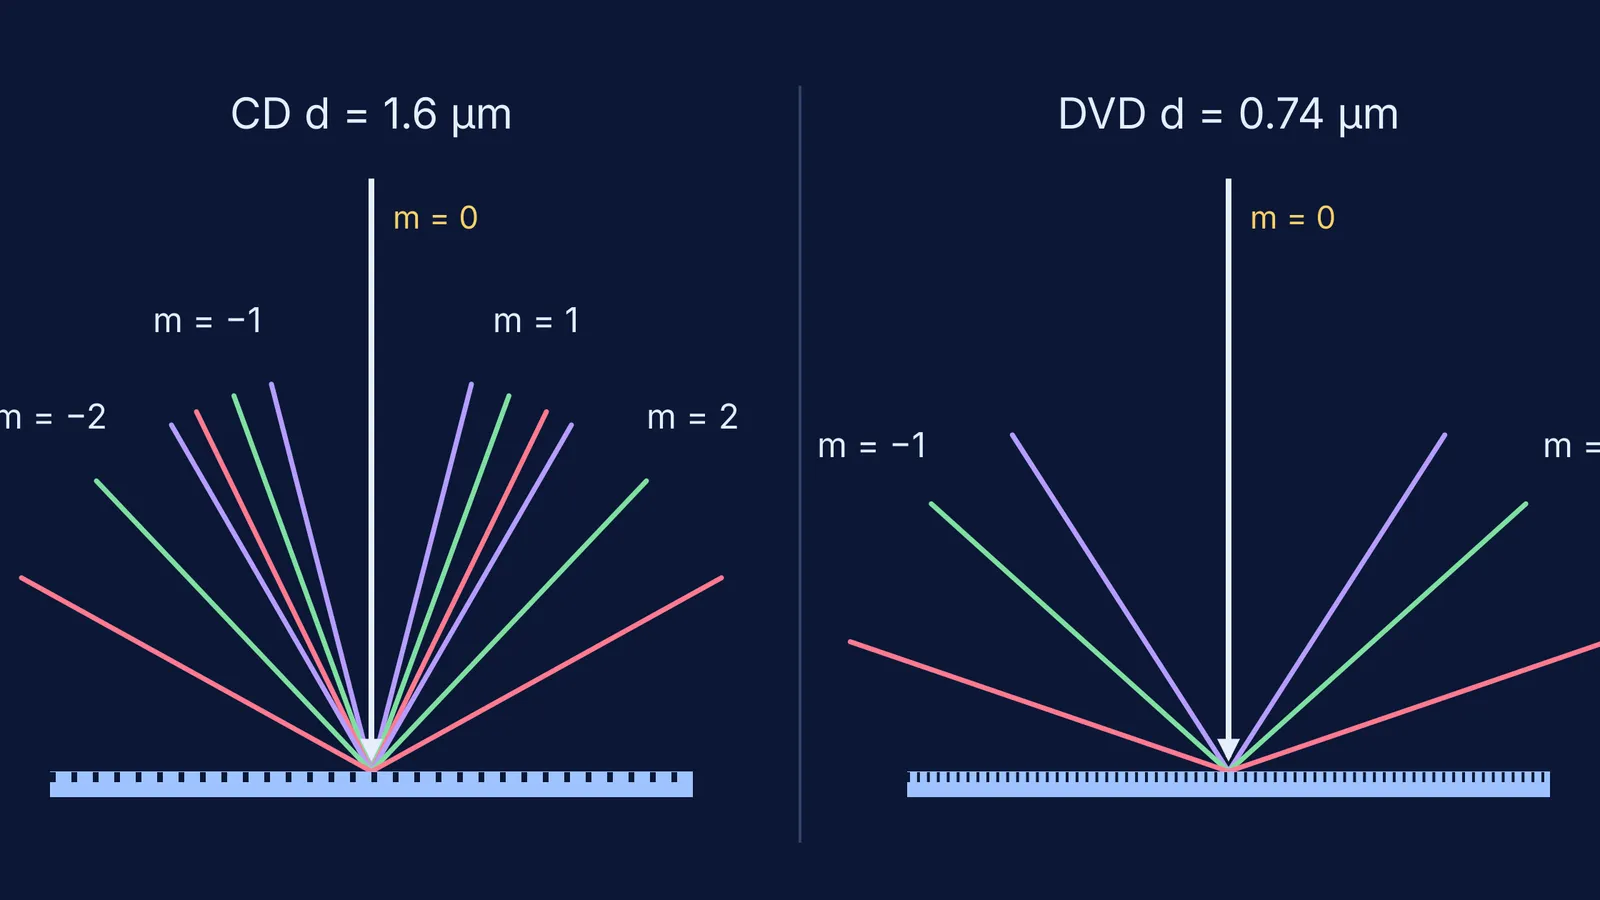
m = 1, violet (400 nm): sin θ = 400/1600 = 0.25, so θ ≈ 14.5°.
m = 1, green (550 nm): sin θ = 0.344, so θ ≈ 20.1°.
m = 1, red (700 nm): sin θ = 0.4375, so θ ≈ 25.9°.
m = 2: violet at 30.0°, green at 43.4°, red at 61.0°.
m = 3: sin θ cannot exceed 1, so only wavelengths up to 533 nm make it; violet lands at 48.6°, inside the second-order band.
Three things follow. Red bends more than violet, the opposite of a glass prism. The second rainbow stretches over about 31°, the first over about 11°. And the second and third orders overlap, so the outer bands on a tilted CD look less pure than the first rainbow.
Why does a DVD look different from a CD?
The ECMA-267 standard for DVD (clause 10.6.2) sets the DVD track pitch at 0.74 µm ± 0.03 µm, less than half the CD's spacing and about 1350 tracks per millimetre. Put d = 740 nm into the same equation:
violet (400 nm): θ ≈ 32.7°
green (550 nm): θ ≈ 48.0°
red (700 nm): θ ≈ 71.1°
A second order would need λ of 370 nm or less, below the visible range. So a DVD shows a single first-order rainbow on each side, spread over nearly 40° at steeper angles, instead of the CD's repeating bands. Closer lines mean larger sin θ, so wider angles.
How can you test this with a simulation and a real disc?
A grating simulation lets you change one thing at a time. Use the grating equation from OpenStax and write each prediction down before you look:
Set the spacing to 1.6 µm and the wavelength to 550 nm. Predict the first-order angle (20.1°), then read it off.
Keep the wavelength and halve the spacing to 0.8 µm. Does the angle double? It does not: sin θ doubles, so θ goes from 20.1° to 43.4°.
Sweep the wavelength from 400 nm to 700 nm at the CD spacing and watch the first-order spot move from 14.5° to 25.9°.
Switch to 0.74 µm and count the orders. You should find only one on each side of the centre.
Tilt a real CD and a DVD under a single bright bulb. The equation predicts repeating bands on the CD and one broad rainbow at steeper tilts on the DVD.
When the screen disagrees with your prediction, find the step that went wrong: the path difference, the sine, or the order limit.
The Fermi Simulation Lab has interactive simulations for ideas that are easier to see than to read. Fermi's AI tutor can draw the figure and run the simulation with you, checking your understanding as it goes.
For the wave basics, see our guide to learning waves with simulations. Young's double-slit fringe width problems use the same path-difference idea with two slits instead of thousands. For some history, read how Joseph von Fraunhofer found the dark lines in sunlight.


