

On this page
Have you ever looked at a summer sky filled with fluffy cumulus clouds and noticed they all seem to have perfectly flat bottoms at the exact same height? That invisible ceiling is called the Lifting Condensation Level, and you can calculate it yourself before you even step outside.
Whether you are studying adiabatic processes in physics, or just want to predict the weather like Anna Mani, finding the cloud base comes down to a simple race between two temperatures.
Why does rising damp air cool?
When the sun heats the ground, warm air rises. As this parcel of air moves higher, the atmospheric pressure drops, allowing the parcel to expand. Expanding takes work, which drains the parcel's internal energy, causing it to cool down.
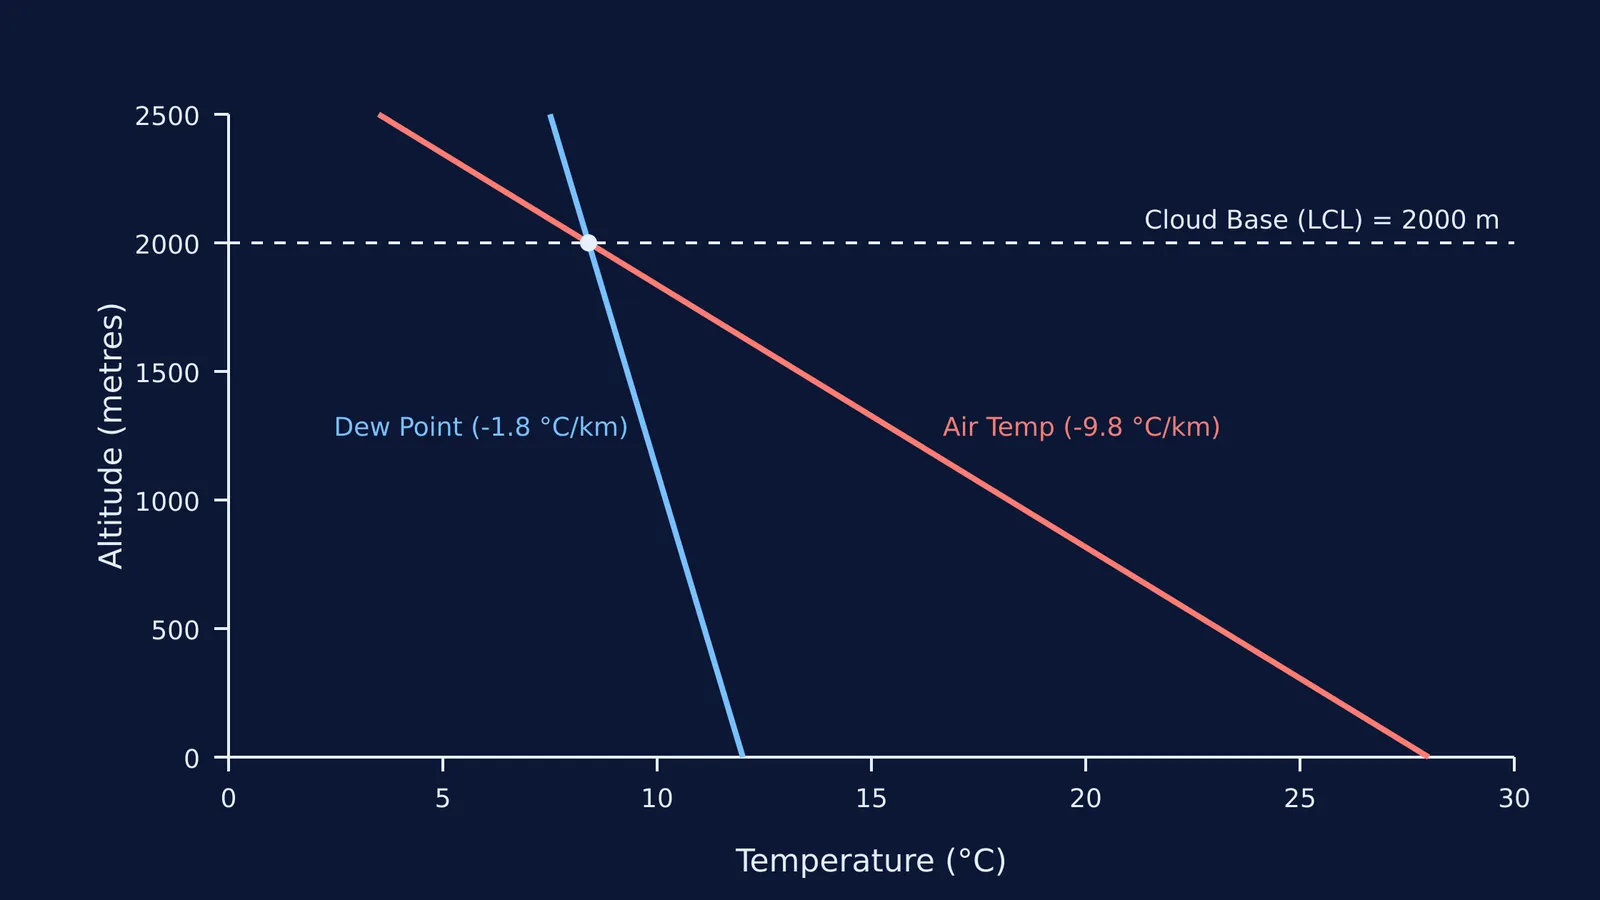
Because no heat is exchanged with the surrounding air, this is a dry adiabatic expansion. According to standard meteorological models, a rising parcel of unsaturated air cools at the dry adiabatic lapse rate of about 9.8 °C per kilometre.
However, the air also contains invisible water vapour. As the air expands, its dew point — the temperature to which it must be cooled to become saturated — also falls. The dew point drops at a much slower rate of about 1.8 °C per kilometre.
How does the 125-metre rule work?
Because the air temperature is dropping faster than the dew point, they are on a collision course. For every 1,000 metres the air rises, the gap between the temperature and the dew point closes by roughly 8 °C (9.8 °C minus 1.8 °C).
If the gap closes by 8 °C every 1,000 metres, we can find out how many metres it takes to close a 1 °C gap: 1,000 divided by 8 is 125.
This gives us the 125-metre rule, a popular analytical approximation for the Lifting Condensation Level. To find the cloud base in metres, simply subtract the surface dew point from the surface temperature, and multiply the spread by 125.
Cloud Base = 125 × (Temperature − Dew Point)
What happens when the air reaches the cloud base?
When the rising parcel of air finally hits the Lifting Condensation Level, its temperature has dropped to exactly match its dew point. This means the relative humidity of the parcel has reached 100%. The air is now fully saturated.
According to atmospheric thermodynamics, the amount of water vapour the air can hold — known as the saturation vapour pressure — decreases almost exponentially as the temperature drops. As the parcel continues to be lifted above the Lifting Condensation Level, it can no longer hold all its invisible water vapour.
The excess moisture must go somewhere, so it begins to condense into liquid water. In the real atmosphere, the air usually needs to become slightly supersaturated (by around 0.5%) before this condensation fully kicks in. This translates into roughly another 10 metres of lifting above the theoretical Lifting Condensation Level. Once condensation begins, millions of microscopic water droplets form, creating the visible, flat-bottomed clouds we see from the ground.
This ongoing condensation also releases latent heat. Because this heat warms the air slightly, the parcel cools at a slower rate as it continues to rise above the cloud base. This slower cooling rate is known as the saturated adiabatic lapse rate.
Why do forecasters track the cloud base?
Forecasters track the Lifting Condensation Level carefully because it is a vital metric for predicting severe weather. On humid days when the air is already very moist at the surface, the dew point is very close to the actual air temperature. This means the Lifting Condensation Level will be very low.
A low cloud base is a key ingredient in severe thunderstorm forecasting because it reduces the amount of evaporative cooling that occurs in storm downdrafts. When rain falls through a high, dry layer below a cloud, it evaporates and cools the air, which can cause strong downdrafts. A low Lifting Condensation Level means there is less dry air below the cloud, changing the dynamics of the storm.
If you struggle to picture how temperature, volume and pressure interact during expansion, the maths can feel abstract. The Fermi Simulation Lab has interactive simulations for the ideas that are easier to see than to read.
Understanding the kinetic theory of gases gives you the tools to read the sky. The next time you see a flat-bottomed cloud, you will know exactly what is happening inside it.


