

On this page
Pour a little copper sulphate solution into a test tube, then add water. The blue fades. Your eye is already doing a rough version of what a colorimeter does: judging concentration from how much light the solution takes out. This post turns that observation into a law you can predict with, and gives you six predictions to test in a colorimeter simulation or a real colorimeter before you trust the formula.
Why does a coloured solution look the colour it does?
White light contains every visible colour. A solution looks coloured because it absorbs some of them. As the LibreTexts Chemistry page on UV and visible absorption puts it, if a colour is absorbed from white light, what your eye sees is its complementary colour. Its example is phenolphthalein in alkaline solution, which absorbs green light at 553 nm and looks magenta.
That is why a colorimeter shines light of the colour the solution absorbs, not the colour it shows. The interesting signal is the light that goes missing.
How does colour intensity relate to concentration and absorbance?
Two numbers describe what happens in the cuvette. In David Harvey's Beer's law chapter on LibreTexts, transmittance is T = P/P₀, the fraction of the incoming light that comes out, and absorbance is A = −log T.
Beer's law then says A = εbc, where ε is the molar absorptivity, b is the path length and c is the molar concentration (Harvey, LibreTexts). Many school books write the same thing as A = εlc.
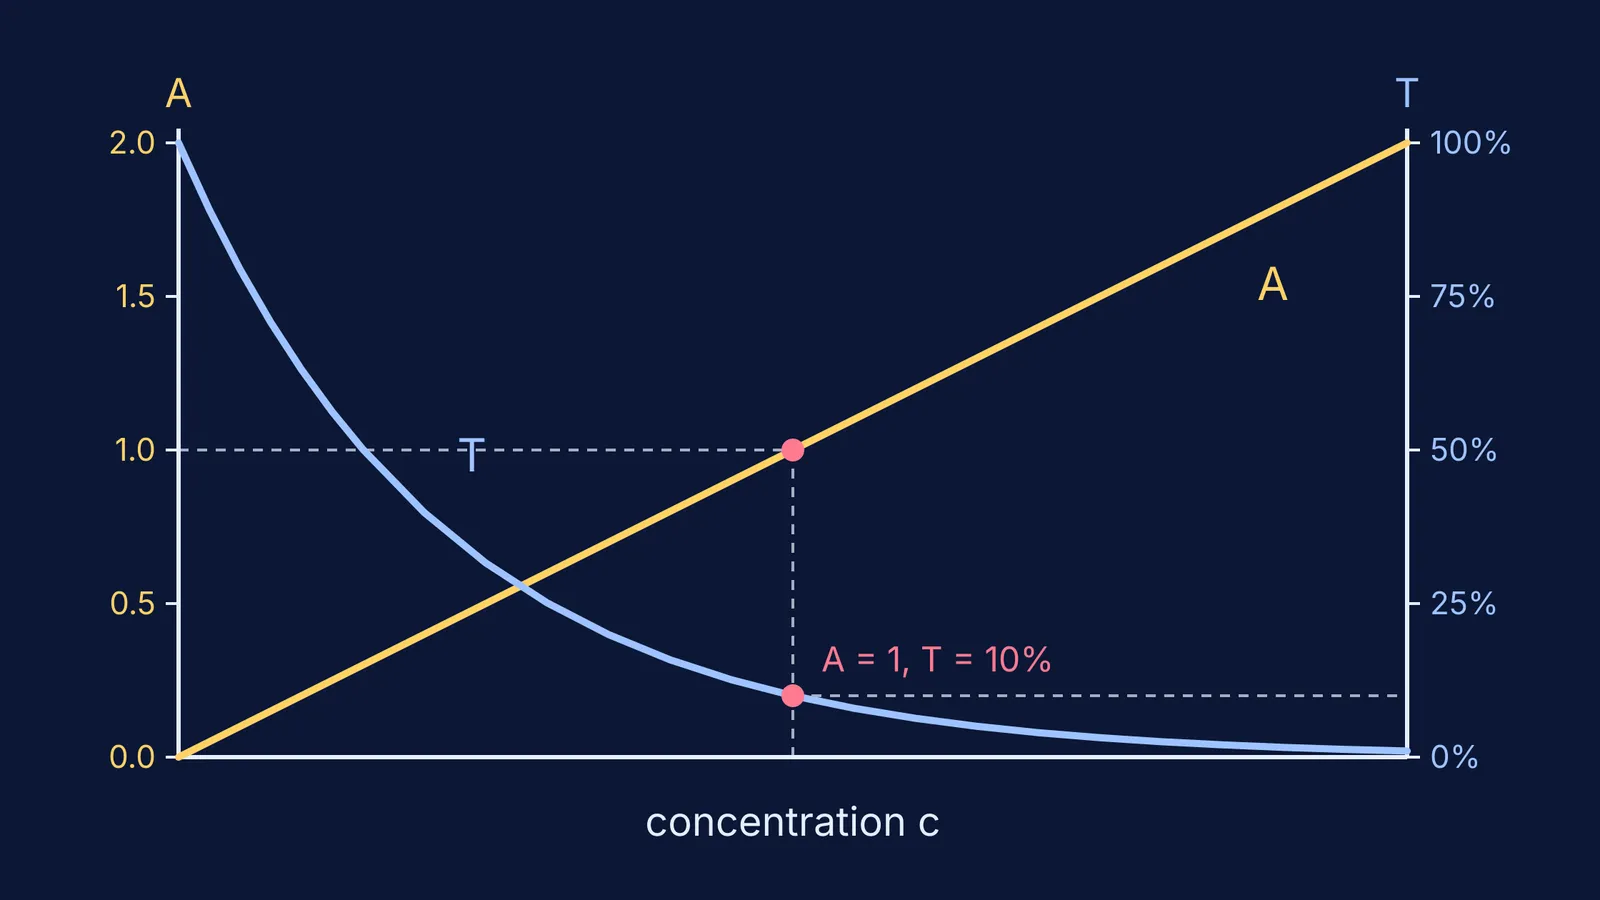
Here is the key idea. Each thin slice of solution absorbs the same fraction of the light reaching it. Ten slices that each let 80% through do not remove 10 × 20% and leave nothing; they leave 0.8 multiplied by itself ten times, about 11%. Light falls away exponentially, so a graph of T against concentration is a curve. Taking the logarithm turns that repeated multiplication into addition, so absorbance grows in equal steps: a straight line through the origin.
An absorbance of 1 means 90% of the light at that wavelength has been absorbed and 10% is transmitted, according to the LibreTexts page on the Beer-Lambert law. By the same rule, T = 10^(−A), an absorbance of 2 lets through 1%.
A worked example with real numbers
The same LibreTexts Beer-Lambert page gives guanosine a molar absorptivity of 8400 L mol⁻¹ cm⁻¹ at 275 nm. Take a 5.0 × 10⁻⁵ mol/L solution in a standard 1 cm cuvette.
Absorbance: A = 8400 × 1 × 5.0 × 10⁻⁵ = 0.42.
Transmitted light: T = 10^(−0.42) ≈ 0.38, so about 38% gets through.
Double the concentration: A = 0.84, and T ≈ 14%. Absorbance doubled; transmitted light did not halve.
Now double the path length too, to 2 cm: A = 1.68, and T ≈ 2%.
Work backwards: if an unknown sample reads A = 0.63 in the 1 cm cuvette, c = 0.63 ÷ 8400 ≈ 7.5 × 10⁻⁵ mol/L.
Step 5 is what a calibration graph does: measure a few standards, draw the line, read the unknown off it. If molarity itself feels shaky, our guide to molarity, molality and other concentration units is a good warm-up.
What to predict in a colorimeter simulation
A simulation earns its place here because you can change one thing at a time and see two readings move together. Write each prediction down before you move the slider.
Double the concentration. Does A double? Does T halve?
Double the path length instead. Is the change in A the same as doubling the concentration?
Halve both. What happens to A?
Switch to a light colour the solution does not absorb. What happens to A at any concentration?
Set A to 1, then 2. What percentage of light gets through each time?
Push the concentration very high. Does the A line stay straight?
For other topics, the Fermi Simulation Lab has interactive simulations for ideas that are easier to see than to read. For when a simulation helps more than a textbook figure, and when it does not, see what studies found about simulations and static diagrams.
When does Beer's law stop giving a straight line?
The last prediction matters. Harvey describes Beer's law as a limiting law that is valid only for low concentrations (LibreTexts). At high concentrations the particles interact and the refractive index of the solution changes, so the absorptivity itself can change. The same chapter lists instrument causes: stray light that reaches the detector without passing through the sample makes absorbance read lower than expected, and light that is not a single wavelength also gives absorbances smaller than Beer's law predicts.
When you move from a screen to a real colorimeter, our look at virtual chemistry labs compared with hands-on work covers what each teaches. And if the logarithm in A = −log T is the step that feels like magic, the Fermi Concept Library covers every concept in physics, chemistry, biology, mathematics and computing, each with its own lesson.


