On this page
Physics practical exams test more than just your ability to read a micrometer or set up a circuit. A significant portion of your practical marks depends entirely on how you plot and analyse your graph.
According to the AQA Physics Practical Handbook, students routinely throw away easy marks on formatting rules they either forgot or were never taught. Because a visual AI model can struggle to read a faint pencil line accurately enough to check for a half-square deviation, you need a different strategy.
Instead of just snapping a photo, you can get highly accurate feedback by describing your graph's construction to an AI tutor. Here is exactly what the examiners are looking for and how to check your work.
What are the common mistakes in physics practical graphs?
Examiners follow strict marking criteria that leave no room for interpretation. The most frequent errors involve scale, point marking, and the line of best fit.
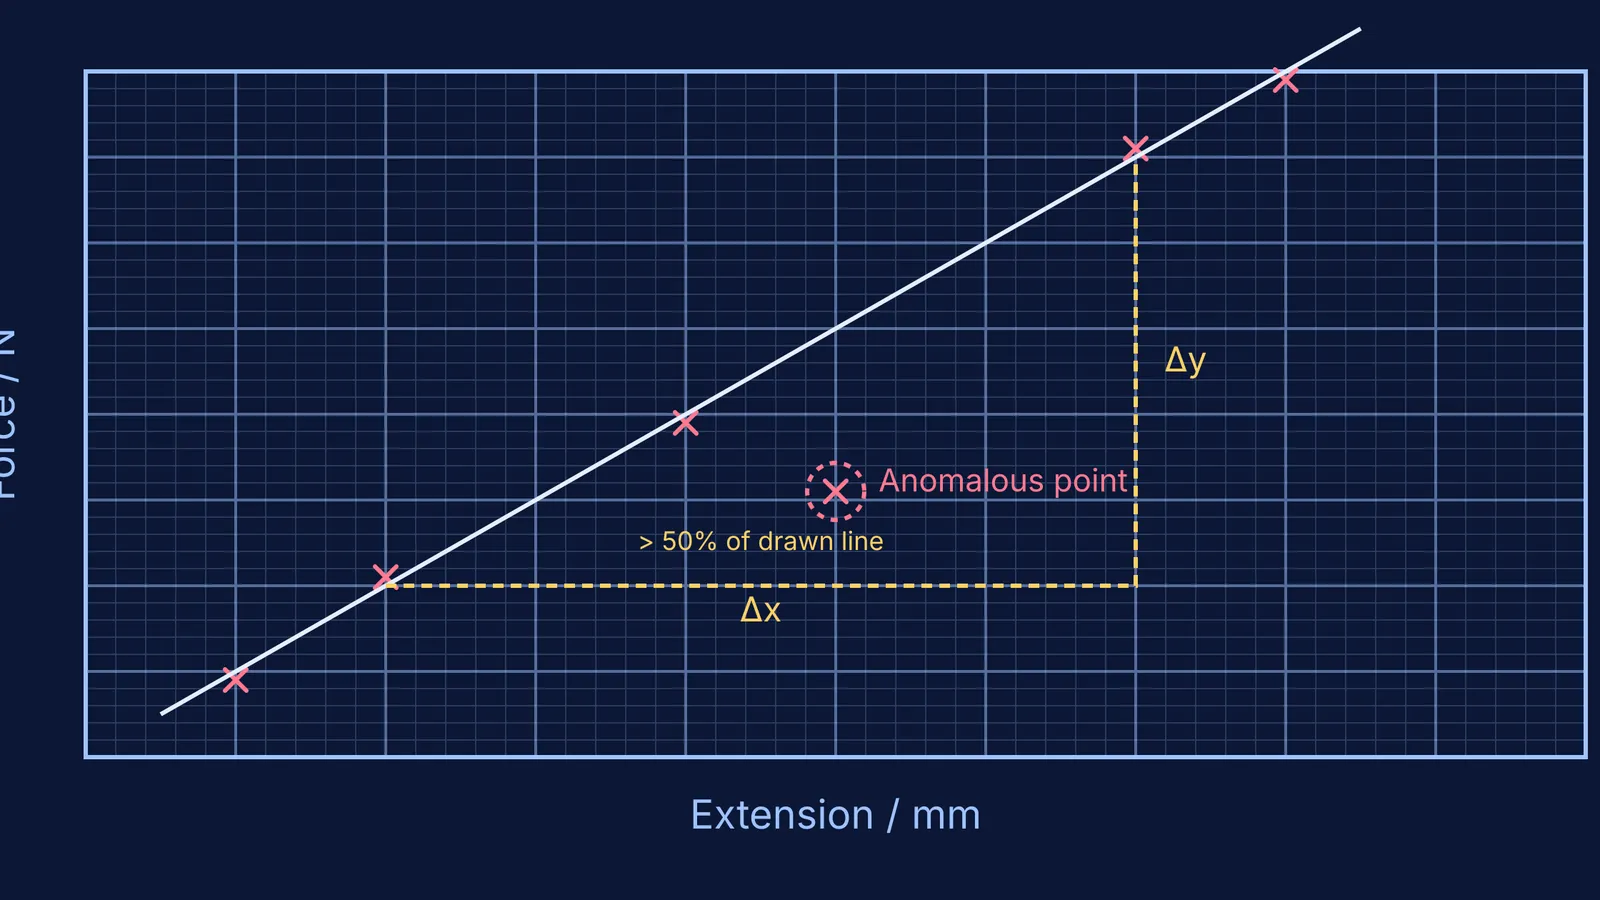
The 50% rule for scales: Your plotted points must span more than 50% of the available grid on both the x and y axes. The AQA handbook explicitly warns against using scales that compress the data into a corner. Furthermore, your scale must be "sensible" (e.g., increments in multiples of 1, 2, or 5). Scales based on awkward numbers like 3, 7, or 11 are penalised because they make interpolation error-prone.
Marking data points: The AQA handbook states that data points should be marked with a cross (either a × or a +). Care must be taken to ensure they can be seen against the grid; thick blobs or large dots will obscure the exact coordinate.
Dot-to-dot lines: The line of best fit must be a single, smooth line (straight or curved) that balances the points. It must not be forced through the origin unless the physical model demands it.
Tiny gradient triangles: When calculating the gradient, the hypotenuse of your chosen triangle must cover more than 50% of your drawn line. Using two adjacent data points from your table to calculate the gradient is a classic mistake; you must read coordinates directly from your line of best fit, separated by a large distance.
How can I describe my graph to an AI for feedback?
While you can upload a photo of your graph, an AI might miss that your "x" mark is slightly wider than half a small square or that your gradient read-off is imprecise. You get much better feedback by treating the AI as an examiner and giving it the structural details of your plot.
If you aren't sure where you went wrong, Fermi's AI tutor can work out what you already know and build a plan for the session. You can prompt it by stating the rules you applied. When evaluating a graph, write out a short checklist of the choices you made.
The AI will immediately flag the awkward scale (multiples of 3 are forbidden), the violation of the 50% coverage rule, and the small gradient triangle. This active approach to feedback forces you to think critically about your own work. Instead of passively looking at a mark scheme, you are actively auditing your graph's construction. Once you have this feedback, you can redraw the graph using a 1-to-2 scale and a triangle that spans the full page, ensuring you capture all the available marks.
What else does an examiner check?
Once the basic plotting is sound, examiners look at the physics represented on the page.
Anomalous results: If one point lies far from the trend, you should circle it and ignore it when drawing your line of best fit.
Axis labels: Axes must strictly follow the Quantity / Unit format (e.g., T² / s²). Missing the unit or using an incorrect symbol automatically loses a mark.
Significant figures: The final calculated gradient and y-intercept should match the precision of your raw data, which is typically 2 or 3 significant figures. Never write down eight decimal places just because your calculator displays them.
Intercept calculation: If your graph does not start at the origin (0,0), you cannot simply read the y-intercept off the axis. You must calculate it algebraically using the equation of a straight line, substituting a coordinate read from your line of best fit.
Practising these checks will make them second nature. By the time you sit the practical exam, selecting a sensible scale and drawing a large gradient triangle will be automatic, leaving you free to focus on the experiment itself. If you struggle with the theory behind the experiment, like why the graph of deviation vs incidence for a prism is a curve while converting PV, PT and VT graphs for ideal gases yields straight lines, tackling the concepts first is the best approach.