On this page
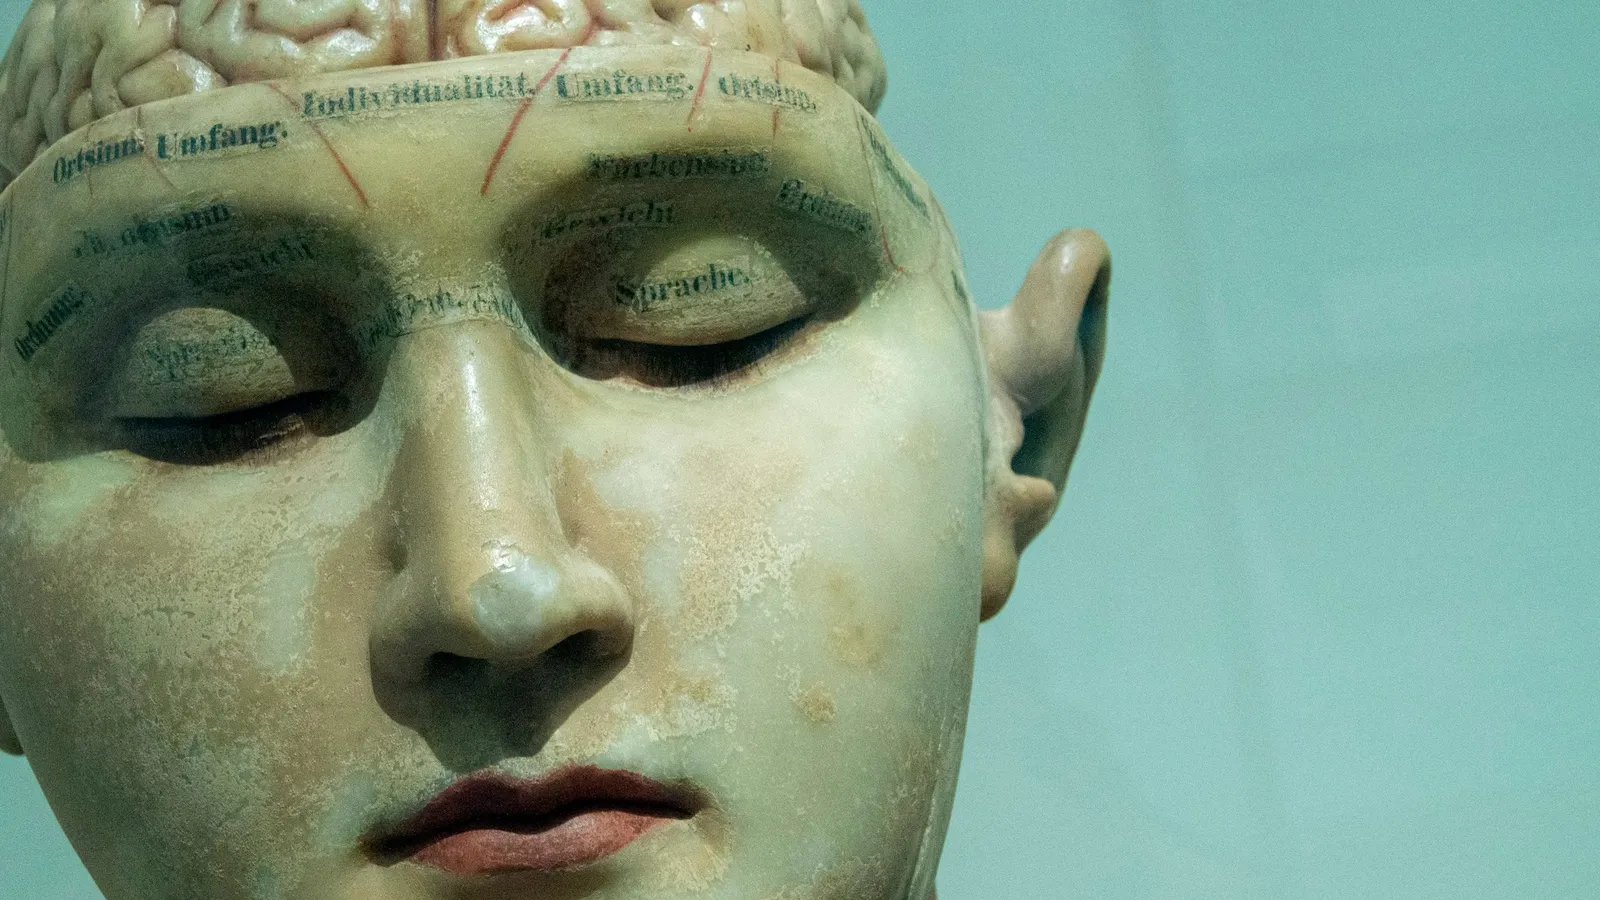
Most biology students have seen the strange cartoon of a little man with huge hands and lips draped over the brain. Few know where it came from. It grew out of operations in which a surgeon touched a weak electric current to the brain of a patient who was awake and could describe what happened. This post covers who Wilder Penfield was, how his method worked, what his map showed, and how scientists are revising it nearly a century later.
Who was Wilder Penfield?
The Neuro's history of Penfield records that he was born in 1891 in Spokane, Washington. He graduated from Princeton in 1913, won a Rhodes Scholarship in 1914 and studied at Merton College, Oxford, where he learned from the neurophysiologist Charles Sherrington and the physician William Osler. In 1916 the ship carrying him to France, the SS Sussex, was torpedoed; he was injured but survived.
He completed his medical degree at Johns Hopkins, interned under Harvey Cushing in Boston, and spent time in Spain learning nerve cell staining and in Germany learning surgical techniques. His Royal Society biographical memoir notes that he brought Sherrington's meticulous methods into the operating room and that founding the Montreal Neurological Institute in 1934 was his major contribution to neurology at large. He directed it until 1960 and died on 5 April 1976, aged 85.
Why operate on patients who are awake?
Penfield treated epilepsy. To remove the tissue where seizures started without harming areas the patient needed, he had to know what each region did. According to The Neuro, surgeons used local anaesthetics so they could stimulate parts of the brain electrically while patients described the sensations triggered.
The Neuro's account gives an example: a woman who smelled burnt toast before her seizures. Penfield stimulated different points and asked when she smelled it, which helped locate the source. The method, published in 1952 as the "Montreal procedure", was adopted by neurosurgeons worldwide, according to The Neuro's history page.
What did the 1937 map show?
In 1937 Penfield and Edwin Boldrey published "Somatic motor and sensory representation in the cerebral cortex of man as studied by electrical stimulation" in Brain. Stimulating some points on the cortex made a body part move; stimulating others made the patient feel a sensation in a body part. Pooled across patients, the motor results were summarised as a continuous map running down the precentral gyrus from foot to face.
A 2023 study in Nature by Gordon and colleagues summarises the stimulation results: movements came from about half of the sites tested, mostly of the foot, hand and mouth. The representations of different body parts overlapped a great deal across patients. The study adds that Penfield later described his homunculus drawing as a memory aid and a cartoon, not a precise map.
How is the homunculus being redrawn?
Gordon's team used precision functional MRI. They found that the classic homunculus in primary motor cortex is interrupted. Regions for the foot, hand and mouth alternate with "inter-effector" regions that are thinner, strongly connected to each other and to a network involved in action, arousal and pain, and active when planning whole-body movement. They named this the somato-cognitive action network. They checked the pattern in the three largest fMRI datasets and found likely precursors in macaques and infants.
This is how science should work. Penfield's broad finding, that specific strips of cortex serve movement and sensation, stands. The neat continuous figure was always a simplification, as he said himself.
Where does this fit in your syllabus?
NCERT Class 11, Chapter 18 (Reprint 2026-27) states that the cerebral cortex contains motor areas, sensory areas and large association areas that are neither clearly sensory nor motor and handle functions like intersensory associations, memory and communication. Neural control and coordination is in the NEET-UG 2026 syllabus; check the current year's version. Our guide to neural control and coordination covers the chapter.
Common mistakes:
Treating the homunculus as an exact anatomical map. Penfield himself called it a cartoon.
Thinking the maps came from healthy volunteers. They came from patients during brain surgery.
Assuming one region does one thing in every person. Penfield's own data showed large overlaps between patients.
What can a student take from Penfield?
Penfield built an institute where surgeons and laboratory scientists worked side by side, because he believed the questions crossed those lines. He also treated each patient's report as data and checked findings across many cases before drawing a map. When a diagram in your textbook looks tidy, ask what measurements sit behind it. If brain anatomy is hard to hold in your head, the Fermi Concept Library covers every concept in biology, each with its own lesson and its place in the map. For the teacher who first drew Penfield to the brain, read about Charles Sherrington and the synapse, and for the first link between a brain area and speech, see Paul Broca.
Next step: sketch the cerebral cortex from NCERT Figure 18.4, label motor, sensory and association areas, and write one line on how each was discovered.