On this page
In short
In the 1940s, P. V. Sukhatme developed crop-cutting experiments to replace the subjective guesswork used to estimate India's harvest. By introducing stratified random sampling, his 1943–44 Punjab wheat survey proved that carefully chosen sample plots—often 1/80th of an acre—could accurately measure the yield of a whole country.
Until the 1940s, predicting how much food India would produce was largely a matter of "eye estimation." Under the old Annawari system, local revenue officials stood at the edge of a field and simply guessed its yield. They used a 16-anna scale—based on the old currency where 16 annas made a rupee—where 12 annas typically represented a normal, healthy crop. If an official decided the crop looked poor, they might declare it a 6-anna harvest, triggering tax relief or drought assistance.
This subjective method was prone to massive errors. Because it relied on human judgment rather than physical measurement, it was almost impossible to trust the numbers at a national scale. During times of crisis, India needed a way to plan for food security using objective, mathematical facts rather than local guesswork. P. V. Sukhatme, working as a statistical adviser, changed this by bringing rigorous probability to the fields.
What is stratified random sampling?
Sukhatme realised that to measure a country, you do not need to harvest every field. You just need the right sample. In 1943–44, he proved this by leading an enormous crop-cutting survey to estimate the wheat yield across the Punjab.
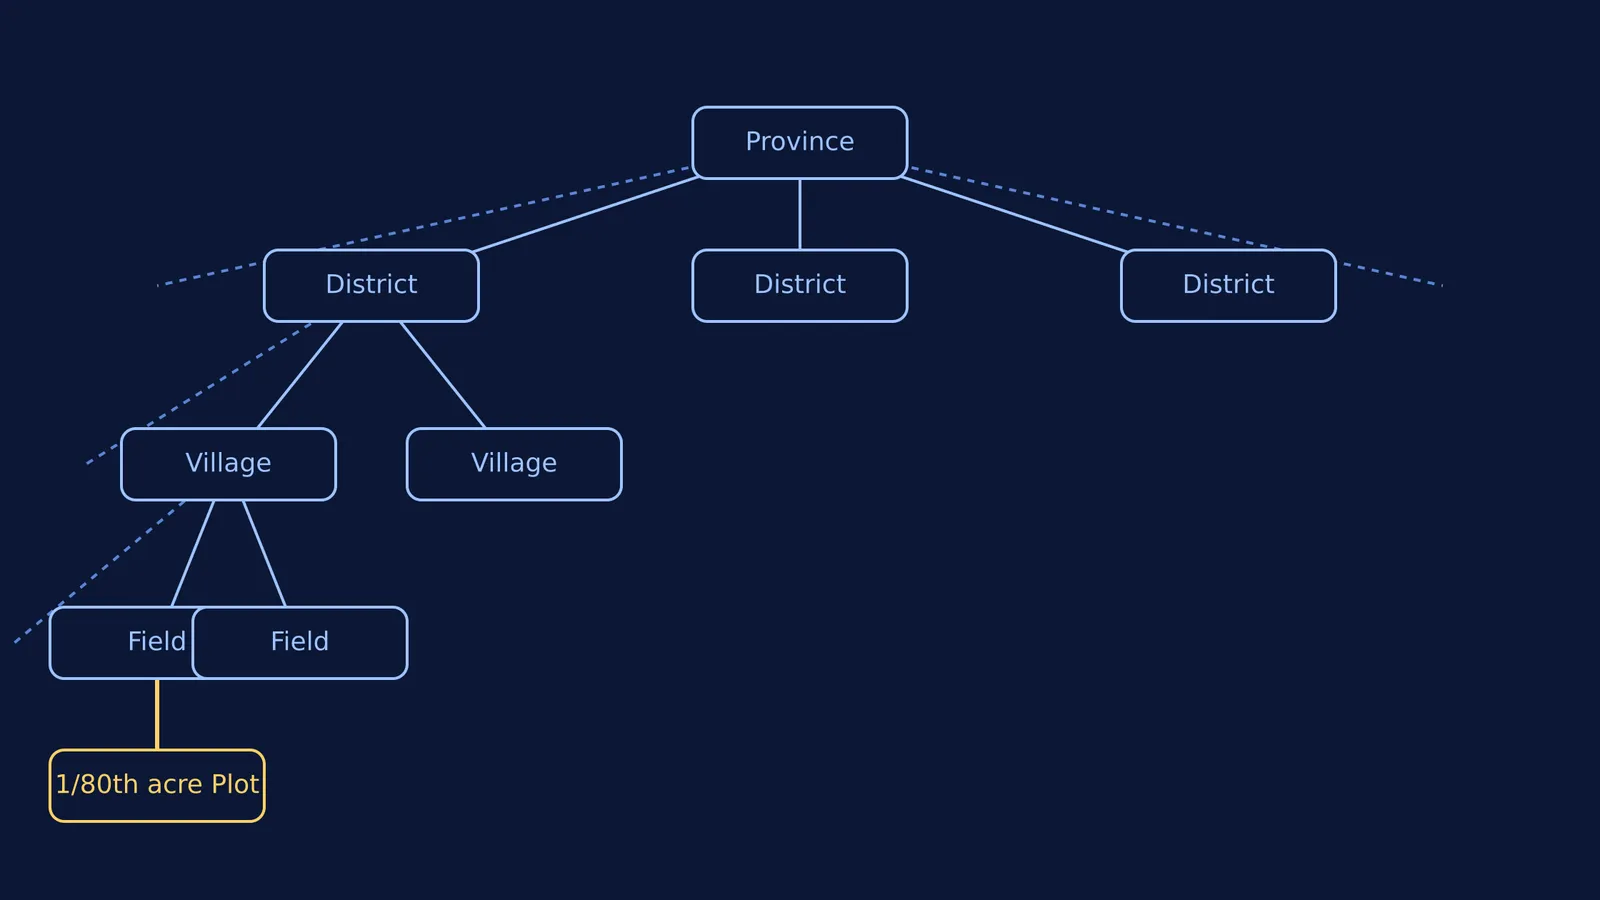
Instead of sending workers out randomly across the whole map, he used a method called stratified multi-stage random sampling. First, he divided the province into large "strata" or districts. From each district, a set of villages was randomly selected. From each village, specific fields were chosen at random, and from each field, a precise smaller plot was marked out for harvesting.
Because every plot was chosen by chance rather than by a local official's preference—a rigorous application of probability similar to drawing samples with and without replacement—the resulting yield estimate was objective. It came with a calculated margin of error, proving that a tiny fraction of the land could accurately represent the entire province. This framework eventually became the foundation for India's General Crop Estimation Surveys (GCES), scaling up to large-scale crop-cutting experiments nationwide.
How did P. V. Sukhatme fix the border bias?
While statisticians agreed on the power of random sampling, a fierce debate erupted over exactly how big a sample plot should be. P. C. Mahalanobis, another giant of Indian statistics and founder of the Indian Statistical Institute, argued for using extremely small circular plots (often with a radius of just a few feet). He believed small plots were cheaper and could be harvested quickly by highly trained, travelling scientists.
Sukhatme strongly disagreed. In a landmark 1947 paper, "The Problem of Plot Size in Large-Scale Yield Surveys", he proved that very small plots lead to a systematic overestimation of the crop. The root of the problem was the perimeter. When a worker harvests a tiny plot, they inevitably encounter plants that sit exactly on the boundary string. Human nature and the physical thickness of the crops lead workers to accidentally include these borderline plants in the sample. In a small circle, the perimeter is huge compared to the area inside, so this "border bias" heavily inflates the final weight of the grain.
Finding and removing such biases is why statisticians emphasize looking at data before testing it. Sukhatme advocated for larger, rectangular plots—typically 1/80th of an acre. A larger rectangle has far more area relative to its perimeter, meaning any mistakenly included borderline plants make up an insignificant fraction of the total harvest. Furthermore, because these larger plots were less sensitive to tiny boundary errors, they could be reliably harvested by existing local revenue officials instead of requiring a specialized team of scientists.
What can sample surveys teach us about exam prep?
Sukhatme's great insight was that you cannot measure everything, but a well-chosen, unbiased sample tells you exactly where the whole system stands. The same mathematical principle applies when you are studying for high-stakes exams with vast syllabuses, such as the JEE or NEET.
You cannot possibly review every single textbook page or solve every variation of a physics problem in the final weeks before an exam. Instead, you must rely on your own form of crop-cutting: taking mock exams and solving representative problem sets across different topics. Your mistakes on this sample reveal the true health of your overall knowledge, but only if the sample is honest. If you only practice the topics you already like, you introduce a massive bias, just like an official hand-picking the best field.
If your sampling reveals a gap and you do not know where to start, Fermi's AI tutor can work out what you already know and build a plan for the session, so you sit down to a clear next step. When you need to drill down into those weaknesses and fix the root cause, the Fermi Problem Library has worked problems with a step-by-step solver that explains the reasoning rather than printing an answer.
By choosing your practice questions carefully and analysing the results without bias, you stop guessing your readiness by "eye estimation" and start measuring it like a statistician.