On this page
Most students meet Gregor Mendel as a Punnett square and a 3:1 ratio to memorise for the board exam. That skips the part worth learning: how one person with garden peas, a paintbrush and a notebook turned thousands of counted seeds into rules that genetics still uses. This post walks through what Mendel actually did, checks his numbers with you, and pulls out the working habits you can copy.
What problem was Mendel trying to solve?
Mendel presented his paper, *Experiments in Plant Hybridization*, at two meetings in Brünn (now Brno) on 8 February and 8 March 1865. In the English translation he notes that, despite careful work by earlier breeders, "no generally applicable law governing the formation and development of hybrids has been successfully formulated". His diagnosis was simple: nobody had counted the offspring generation by generation and worked out "their statistical relations".
He knew the job was big. "It requires indeed some courage to undertake a labor of such far-reaching extent," he wrote, and he described the paper as the result of "eight years' pursuit".
Why did he choose peas?
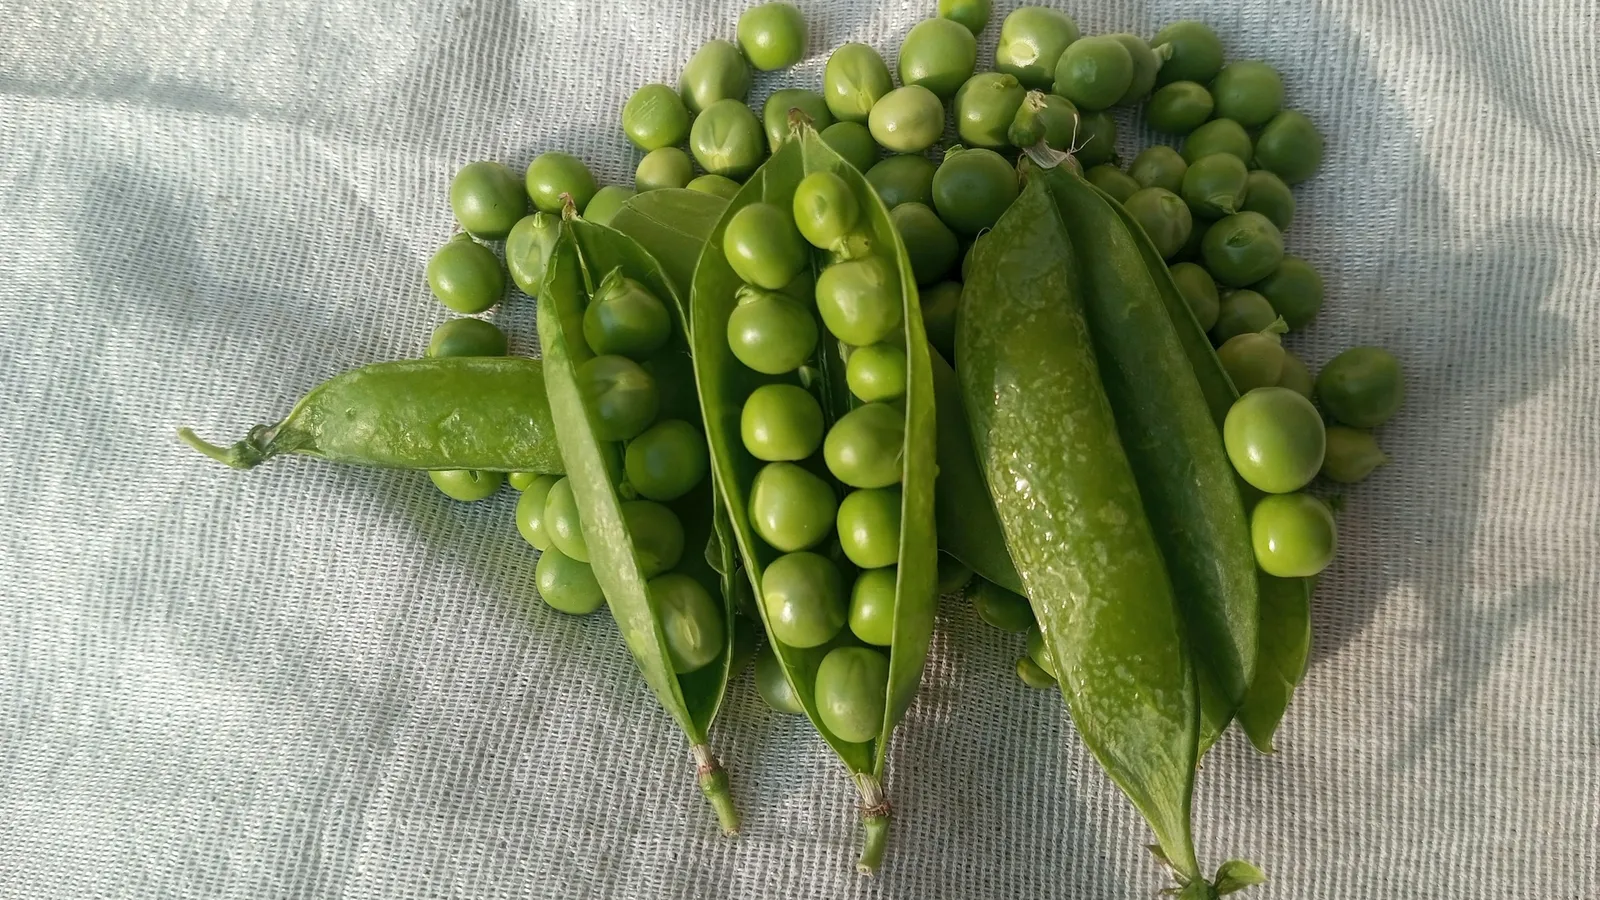
Mendel needed plants whose traits were constant and easy to tell apart, and whose pollination he could control. He obtained 34 varieties of peas from seedsmen and grew them for two years to check that they bred true, then kept 22 for the experiments. Among more than 10,000 plants he examined, he found only a few cases of accidental cross-pollination.
He tracked seven characters, each with two forms, such as round or wrinkled seeds, yellow or green seeds, and tall or short stems. Pollen could be moved by hand with a small brush, so he decided which plant fertilised which.
What did his numbers actually show?
Here is the worked check, using Mendel's own counts from the paper.
Seed shape. From 253 hybrid plants he got 7,324 seeds: 5,474 round and 1,850 wrinkled. 5,474 ÷ 1,850 = 2.96, so the ratio is 2.96:1. As a fraction, 5,474 ÷ 7,324 = 0.747, very close to 3/4.
Seed colour. 8,023 seeds: 6,022 yellow and 2,001 green. 6,022 ÷ 2,001 = 3.01, so 3.01:1.
All seven traits together gave an average ratio of 2.98:1, which Mendel read as 3:1.
He also reported how much single plants varied. One plant gave 43 round and only 2 wrinkled seeds; another gave 14 round and 15 wrinkled. Small samples wander. Only the large totals settle near 3:1.
How did he show that 3:1 is really 1:2:1?
A round seed in the second generation could be pure-breeding or a hybrid that only looks round. Mendel grew them to find out. Of 565 plants raised from round seeds, 193 gave only round seeds again, while 372 gave both kinds in a 3:1 ratio. 372 ÷ 193 = 1.93, close to 2:1. For seed colour the figures were 166 and 353, a ratio of 2.13:1.
So among the plants showing the dominant trait, two-thirds were hybrids and one-third were pure. Add the recessive quarter back in and the second generation splits 1:2:1. In modern notation that is AA : Aa : aa.
How did he find independent assortment?
Mendel then crossed plants differing in two traits at once. From the hybrids he counted 315 round yellow, 101 wrinkled yellow, 108 round green and 32 wrinkled green seeds, 556 in total.
If the two traits sort independently, you expect 9:3:3:1. Work it out: 556 ÷ 16 = 34.75, so the expected counts are 312.75, 104.25, 104.25 and 34.75. His observed 315, 101, 108 and 32 sit close to every one.
What happened to the work after 1865?
Mendel died in 1884. In 1900, a generation after he published, three botanists, Hugo de Vries, Carl Correns and Erich von Tschermak, independently rediscovered his work while preparing their own results on plant hybrids. By then, the National Human Genome Research Institute notes, cells and chromosomes were understood well enough to give Mendel's abstract factors a physical home.
Mendel's data have been argued over ever since. The statistician R. A. Fisher reconstructed the experiments in a 1936 paper and concluded that "there can, I believe, now be no doubt whatever that [Mendel's] report is to be taken entirely literally". Whether some of the counts fit the expected ratios too neatly is a separate argument, revisited in a 2007 commentary in *Genetics* titled "Mud sticks: on the alleged falsification of Mendel's data".
Common mistakes students make with Mendel
Treating 3:1 as exact. It is an expected ratio. In a cross with four offspring, all four can show the dominant trait.
Forgetting the two-thirds. If an F2 plant shows the dominant trait, the chance it is a hybrid is 2/3, not 1/2. Mendel's 372 versus 193 is that fact in real plants.
Mixing seeds and plants. Seed shape and colour were scored on seeds; stem length and flower position were scored on grown plants.
Skipping the expected counts. Always compute expected numbers from the total before comparing, as in the 9:3:3:1 check above.
What can a student take from Mendel's way of working?
Pick a system you can control. Count far more than feels necessary. Make a prediction (if 3:1 hides 1:2:1, then the next generation must split 2:1) and run the experiment that tests it. And keep records detailed enough that someone can check you a century later, which is exactly what Fisher did.
When the terms blur (allele, genotype, segregation, assortment), the Fermi Concept Library covers every concept in physics, chemistry, biology, mathematics and computing, so you can look up one idea at a time. For how genetics fits your syllabus, see our guide to using NCERT for NEET.
Try it now: cover the expected values above, work out 9:3:3:1 for 556 seeds yourself, and compare.