

On this page
In 1905, the city of Bombay (now Mumbai) suffered a severe outbreak of the plague. Like many epidemics throughout history, cases rose rapidly, peaked, and then fell away, forming a predictable bell-shaped curve. At the time, nobody could prove mathematically why the disease stopped spreading when there were still thousands of healthy people left in the city.
In 1927, two scientists, William Kermack and Anderson McKendrick, published a paper titled "A Contribution to the Mathematical Theory of Epidemics" (Source: Proceedings of the Royal Society A, 1927). They applied differential equations to population data, establishing what is now known as the SIR model.
What is the SIR model?
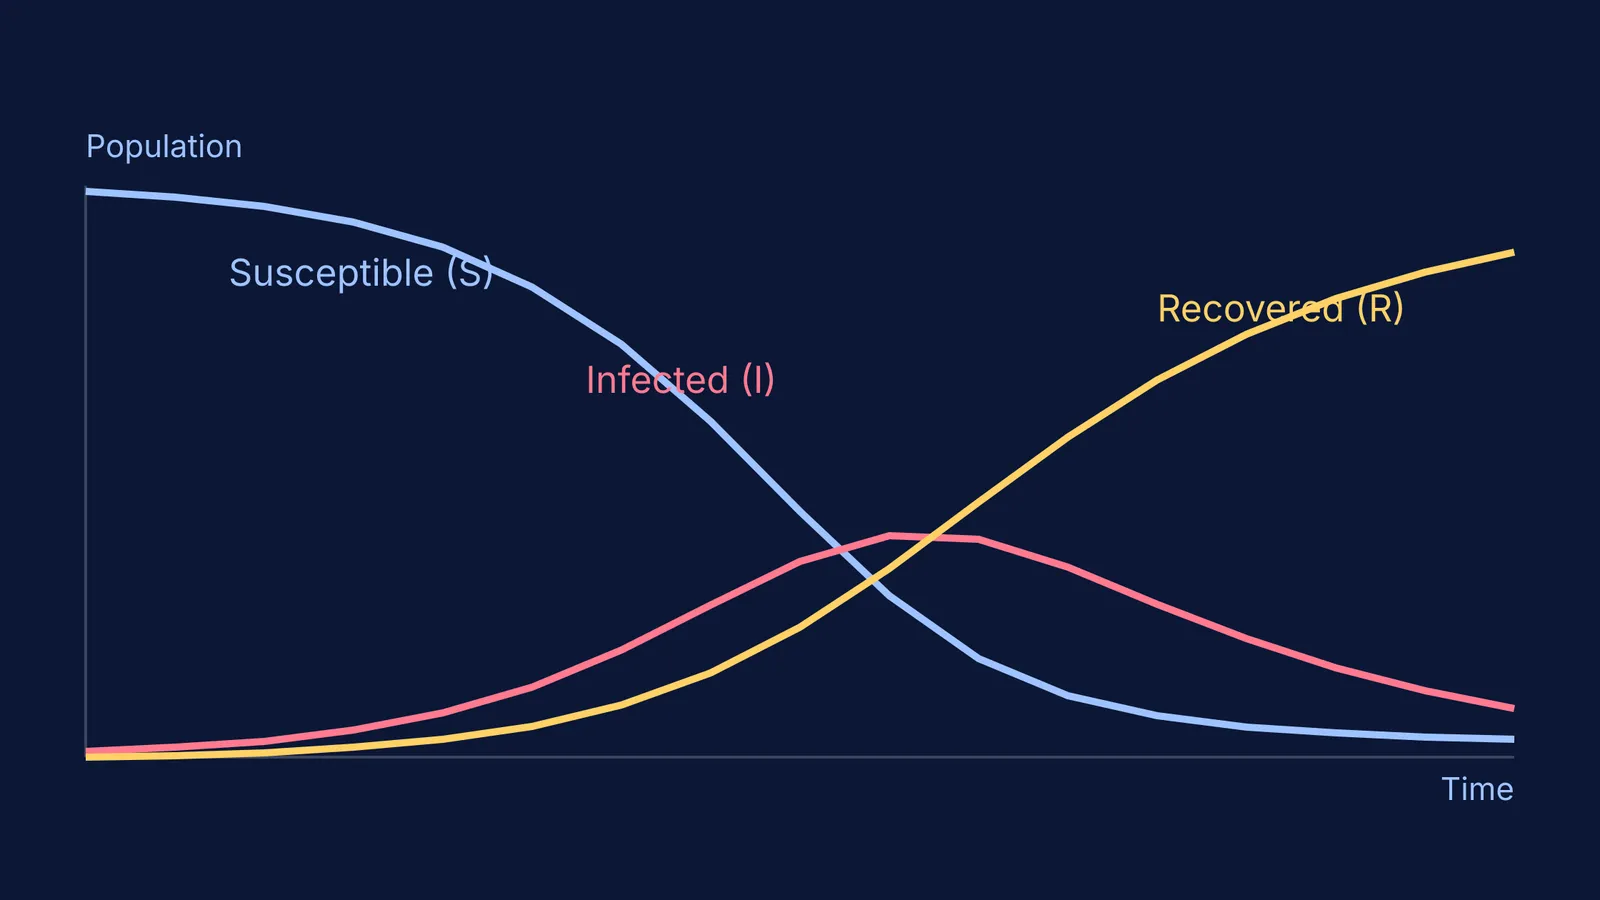
The SIR model divides a population into three groups, or compartments:
Susceptible (S): Healthy individuals who can catch the disease.
Infected (I): People who have the disease and can transmit it to others.
Recovered (R): People who have survived or died, and can no longer spread it or catch it again.
As time passes, people move from the Susceptible group to the Infected group, and then from the Infected group to the Recovered group. Kermack and McKendrick wrote equations showing that the rate of new infections depends on both the number of currently infected people and the density of susceptible people. The math works much like the equations used for population growth and cooling in physics and biology.
Specifically, the model uses a system of three differential equations. The susceptible population drops as individuals meet infected people. The infected group gains these new cases but loses people as they recover. The recovered group grows steadily as the infected group shrinks. Because every person must be in one of the three compartments, the total population size remains constant.
If you struggle to picture how these three curves change over time, the Fermi Simulation Lab has interactive simulations for the ideas that are easier to see than to read, letting you adjust the infection rates and watch the populations shift visually.
What is the threshold theorem?
Kermack and McKendrick's most famous discovery was the threshold theorem. Before their work, many assumed an epidemic would keep spreading until it ran out of people to infect.
Their equations proved otherwise. For an epidemic to grow, the density of susceptible people must be above a critical threshold. As an outbreak spreads, people are continuously moving into the Recovered group. Once enough people move into the Recovered group, the density of the remaining Susceptible group drops below this critical threshold.
At that point, each infected person passes the disease to fewer than one new person on average before they recover. The epidemic then dies out naturally, leaving a portion of the population completely untouched. Kermack and McKendrick successfully used the 1905–1906 Bombay plague data to prove their theory, showing that the decline was due to the math of population density, not a change in the plague itself.
How do you calculate herd immunity?
The threshold theorem gives us a practical tool: the Basic Reproduction Number (R₀). This number is the average number of secondary infections caused by one infected person in a population with no immunity. If R₀ is greater than 1, the disease spreads.
We can calculate exactly what percentage of a population needs immunity to stop an outbreak, a concept known as the herd immunity threshold. The formula is 1 - 1/R₀.
Here is a worked example you can try yourself:
Imagine a virus where each person infects 4 others, so R₀ = 4.
Divide 1 by R₀: 1 / 4 = 0.25.
Subtract this from 1: 1 - 0.25 = 0.75.
Multiply by 100 to get a percentage: 75%.
This means 75% of the population must be immune (either from recovering naturally or through a vaccine) for the epidemic to stop growing.
This kind of mathematical modelling transformed epidemiology from a descriptive science into a predictive one, offering a powerful tool against everything from seasonal flu to the parasite that causes malaria.
If you find yourself stuck calculating thresholds and limits for your own data, Fermi's AI tutor can work out what you already know and build a plan for the session, checking your understanding as it goes through the calculus steps.


