

On this page
In the early twentieth century, physiologists faced a fundamental puzzle: how does blood absorb oxygen in the lungs and release it where tissues need it most? Plain physical dissolution in water carried too little oxygen to support mammalian life, while permanent chemical bonding would trap the gas. Cambridge physiologist Joseph Barcroft solved this puzzle by mapping how haemoglobin reversibly binds oxygen, showing how blood responds to partial pressure, temperature, and acidity.
Why is the oxygen-haemoglobin dissociation curve S-shaped?
In 1909, Joseph Barcroft and Mario Camis reported in *The Journal of Physiology* that dialysed, pure haemoglobin in water yielded a hyperbolic curve. Adding mineral salts restored the distinct S-shaped, or sigmoidal, curve seen in whole blood. In 1910, Cambridge physiologist Archibald Vivian Hill formulated the Hill equation to fit this cooperative behaviour mathematically: attaching the first oxygen molecule shifts haemoglobin's conformation, raising the affinity of the remaining subunits.
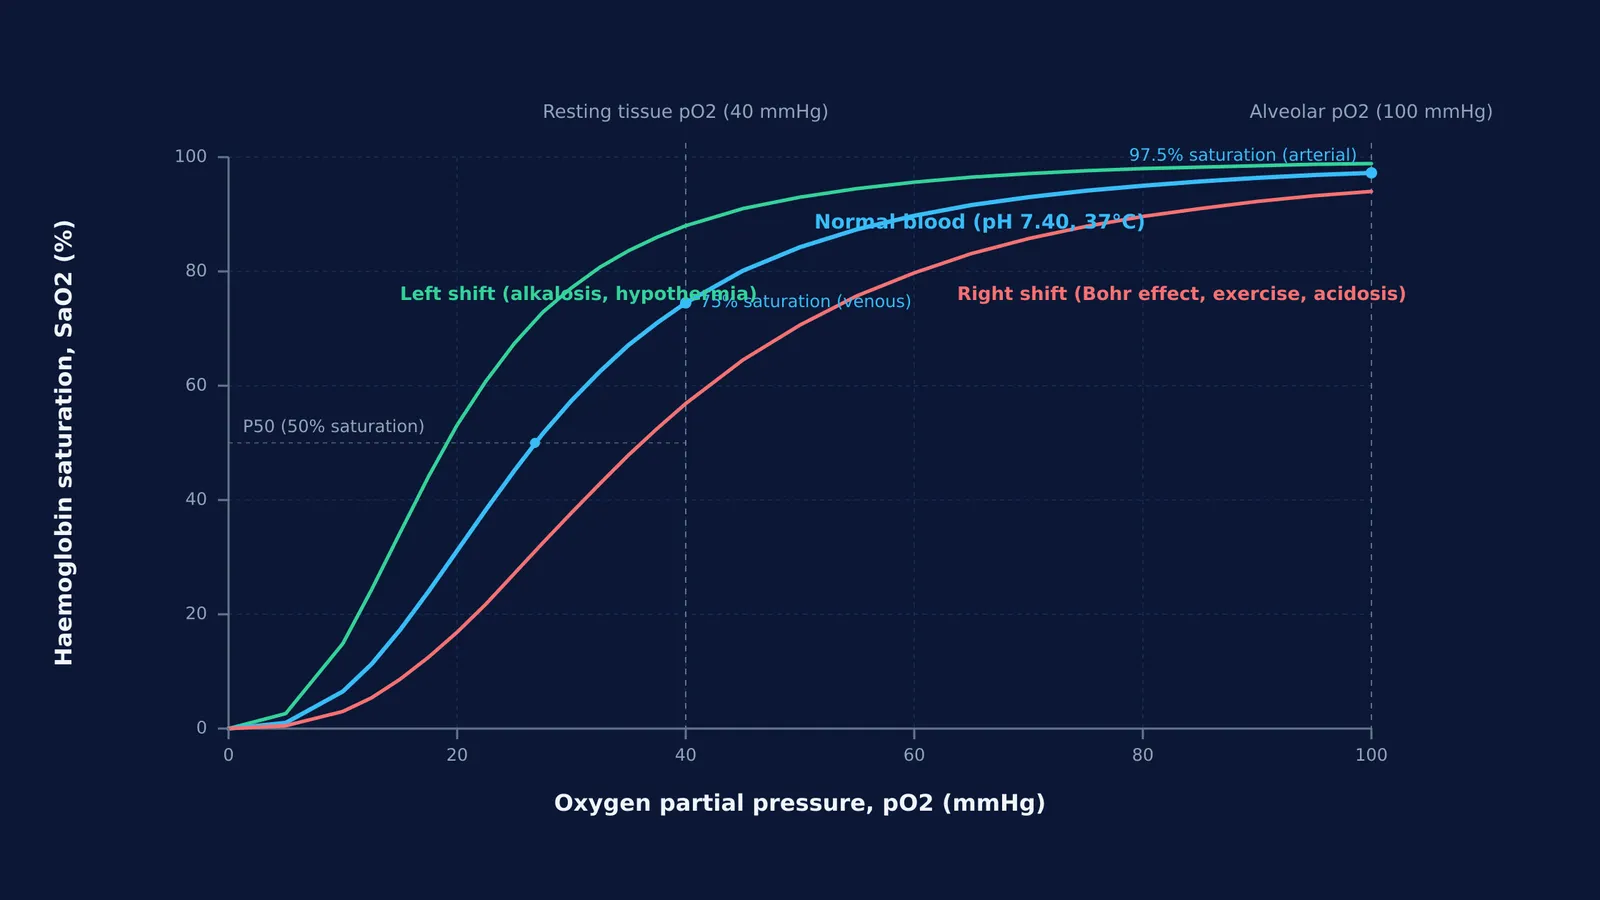
Barcroft expanded these principles in his 1914 classic, *The Respiratory Function of the Blood*. The sigmoidal curve acts as an essential buffer. In pulmonary capillaries, where the partial pressure of oxygen (pO2) reaches 80 to 100 mmHg, the curve flattens near 98% saturation, ensuring dependable loading even when atmospheric pressure dips. In resting systemic tissues, where pO2 falls to 40 mmHg, the curve turns steep, allowing blood to unload roughly 25% of its bound oxygen.
How did Barcroft disprove oxygen secretion in a glass chamber?
A sharp dispute divided Barcroft and Oxford physiologist John Scott Haldane. Haldane proposed that pulmonary epithelial cells actively secreted oxygen into the blood during exertion and at high altitudes, as described in J. S. Haldane's work on respiration. Haldane argued that arterial oxygen tension could exceed alveolar gas pressure.
Barcroft insisted that oxygen exchange relied purely on passive physical diffusion. In February 1920, Barcroft entered a sealed glass chamber at Cambridge for six days to test the hypothesis on himself. As reported in *The Journal of Physiology*, researchers progressively reduced the chamber's oxygen tension to 84 Torr, simulating an altitude of 5,500 metres. A surgeon exposed Barcroft's left radial artery, sampling blood at rest and during bicycle ergometer exercise. In every sample, arterial pO2 remained lower than alveolar pO2, demonstrating that oxygen uptake requires no active cellular secretion.
What happens to oxygen transport at high altitude?
In winter 1921–1922, Barcroft led an expedition to Cerro de Pasco, Peru, at 4,330 metres (14,200 feet) in the Andes. Using a converted railway baggage car on the Central Railway of Peru as a mobile laboratory, the team studied newcomers and native miners, publishing in the *Philosophical Transactions of the Royal Society of London*.
Barcroft documented three adaptations to chronic hypoxia:
Polycythaemia: Chronic low oxygen stimulated red blood cell production, raising erythrocyte counts from 5 million per cubic millimetre to 7 or 8 million, an adjustment seen among the formed elements of blood. Haemoglobin concentrations reached 120% to 140% of sea-level normal values.
Hyperventilation: Residents breathed faster and deeper, lowering alveolar pCO2 from 40 mmHg to 25 to 28 mmHg. This blew off carbon dioxide, producing a respiratory alkalosis that shifted the curve leftward to capture scarce oxygen.
Diffusion limits: Arterial punctures confirmed arterial oxygen saturation averaged 80% to 85% at rest, with arterial pO2 strictly below alveolar levels.
How do physiological shifts alter oxygen delivery?
When studying breathing and gas exchange, standard respiratory physiological principles compiled in StatPearls show how haemoglobin saturation and oxygen content adapt to metabolic demands and altitude:
Sea-level baseline (15 g/dL haemoglobin; each gram binds 1.34 mL O2 at full saturation):
Arterial blood (pO2 95 mmHg, 97% saturation): 15 × 1.34 × 0.97 = 19.5 mL O2 per dL.
Resting venous blood (pO2 40 mmHg, 75% saturation): 15 × 1.34 × 0.75 = 15.1 mL O2 per dL.
Unloaded to resting tissues: 19.5 − 15.1 = 4.4 mL O2 per dL of blood.
Andean highlander (19 g/dL haemoglobin at 4,330 m; arterial pO2 48 mmHg, 83% saturation):
Arterial blood: 19 × 1.34 × 0.83 = 21.1 mL O2 per dL.
The expanded red cell mass allows arterial blood to carry more total oxygen per decilitre than unacclimatised sea-level blood.
Key factors that shift the curve include:
Right shift (lower affinity, easier tissue unloading): Increased pCO2, lower pH (Bohr effect), higher temperature, or elevated 2,3-DPG.
Left shift (higher affinity, tighter loading): Decreased pCO2, higher pH (alkalosis), lower temperature, or fetal haemoglobin.
To see how temperature, pH, and gas pressures change binding curves interactively, the Fermi Simulation Lab provides interactive simulations for ideas that are easier to see than to read. For step-by-step guidance on gas-exchange problems, the Fermi Problem Library offers worked problems with a step-by-step solver that explains the reasoning rather than printing an answer. You can also trace how circulation connects with respiration across the Fermi Concept Library, which covers every concept in biology with its own lesson and its place in the map.


