On this page
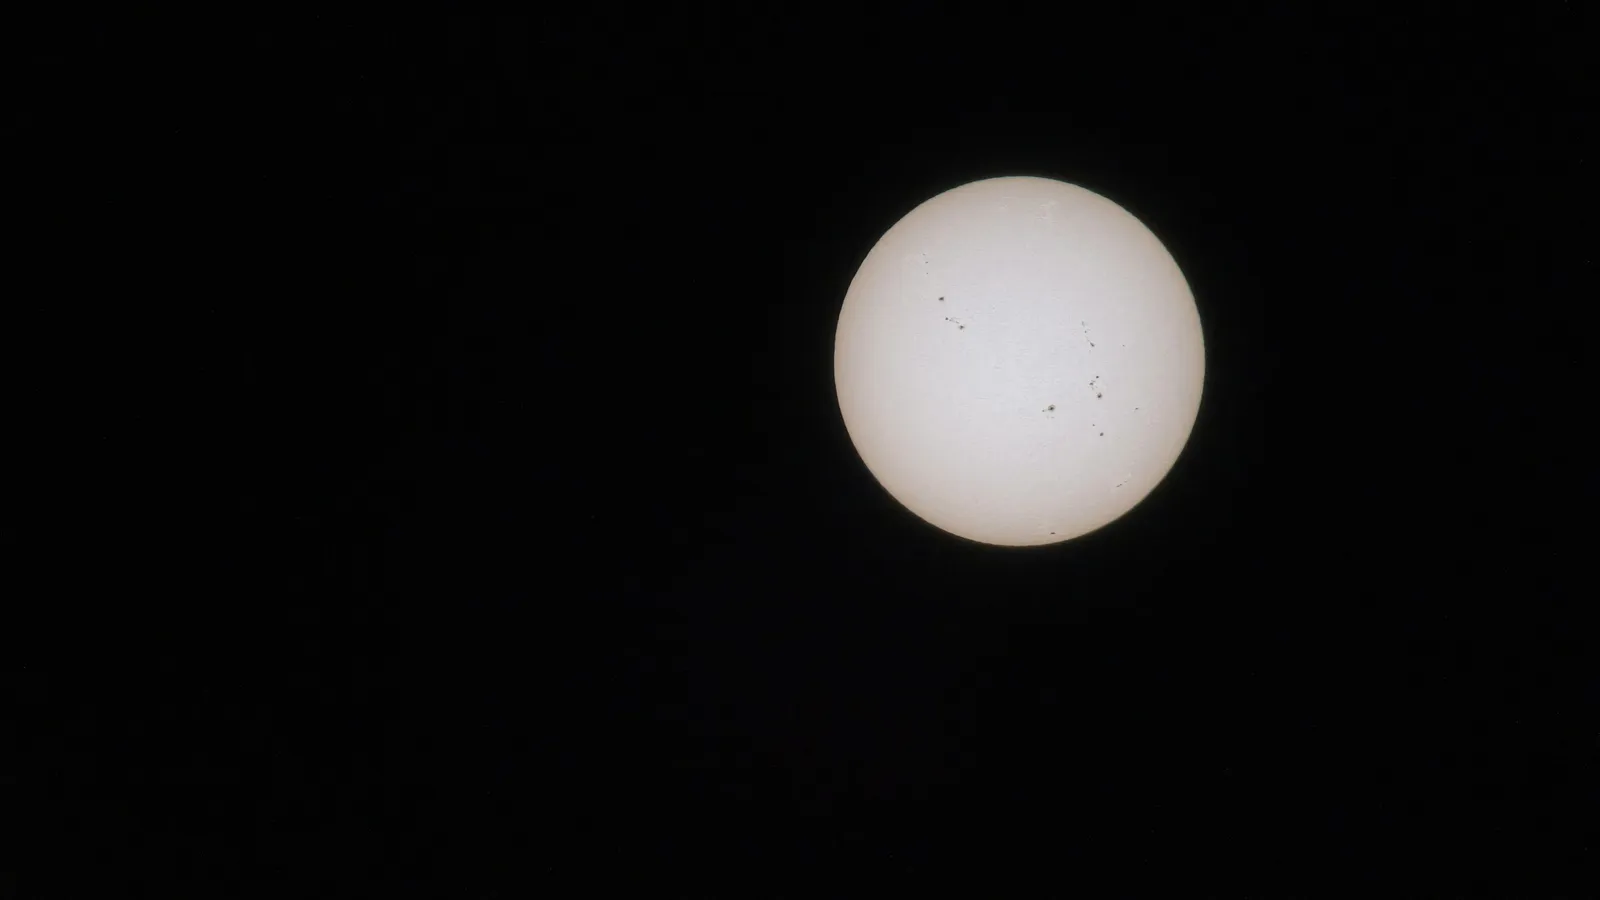
On 7 January 1909, at a hill observatory in Kodaikanal, Tamil Nadu, John Evershed photographed the spectrum of a sunspot and noticed that the dark lines crossing it were very slightly tilted. Over the next two months he showed that gas streams outward from the centres of sunspots at one or two kilometres per second. The flow still carries his name. This post covers who he was, how he ruled out the obvious explanation, the Doppler arithmetic behind his numbers, and lessons for students.
Who was John Evershed?
The Oxford reference work Who Was Who lists him as Evershed, John (26 Feb. 1864–17 Nov. 1956), late Director, Kodaikanal and Madras Observatories. The Royal Society published a biographical memoir of him in 1957.
The Indian Institute of Astrophysics (IIA) history page describes the observatory he came to. In 1893 a committee chaired by Lord Kelvin decided to set up a solar physics observatory at Kodaikanal, chosen after surveys of possible sites, and observations began there in 1901. It took daily photographs of the Sun, a series that IIA says continues to the present day. Evershed arrived in 1907 and soon found new bands in the tail of Comet Daniel that are now attributed to the CO+ ion.
What did he see in the sunspot spectra?
His paper Radial movement in sun-spots, in the Monthly Notices of the Royal Astronomical Society in March 1909, explains it. He used a diffraction grating with 14,428 lines to the inch to spread the light of a spot into a detailed spectrum. The absorption lines crossing the spot were "slightly bent, or inclined one or two degrees" compared with the lines from the surrounding surface.
A tilted line means part of the gas is moving towards us and part away. His first thought was that the spot was rotating. From about 150 spectra of eleven spots he listed seven results, including:
The shifts vanish when a spot is within 10 degrees of the centre of the Sun's disc.
They are largest when the spot is 30 to 50 degrees east or west of the centre.
No shift appears when the slit cuts the spot at right angles to the line joining the spot to the disc centre.
The last result rules out rotation. A spinning spot should show the largest shift in exactly that direction. Instead, everything fits gas flowing straight outward from the centre of the spot, parallel to the Sun's surface.
How did he check it was real?
Tiny shifts can come from the instrument. Evershed photographed a red region of the spectrum where narrow lines from oxygen in Earth's own air sit beside broader solar iron lines. If the tilt were an instrumental effect, the sharp oxygen lines should show it most. They were "absolutely straight, whilst the iron lines beside them are inclined."
He also used a quirk of his equipment. The heliostat feeding his spectrograph turned the Sun's image through about 100 degrees during the day, so the slit cut each spot in a different direction at different hours.
Worked example: getting speed from a wavelength shift
For speeds much smaller than light, the Doppler shift is Δλ/λ = v/c, so v = c × Δλ/λ. Our post on Christian Doppler covers the idea. Use c = 3.0 × 10^5 km/s.
His first plate. It covered 4650 to 4790 Å, so take λ ≈ 4720 Å. He measured a total displacement of 0.027 Å between the two sides of the penumbra, so each side shifts by half: 0.0135 Å.
v = 3.0 × 10^5 × 0.0135 ÷ 4720 ≈ 0.86 km/s. He reported 0.85 km/s, receding on one side and approaching on the other.
His largest shift. For a spot about 40 degrees from the central meridian, the total was 0.040 Å at 4850 Å. Each side: 0.020 Å. v = 3.0 × 10^5 × 0.020 ÷ 4850 ≈ 1.24 km/s, as he reported.
Correcting for the angle. That is only the line-of-sight part of a horizontal flow. He divided by the sine of the spot's angular distance from the disc centre, sin 42° ≈ 0.67: 1.24 ÷ 0.67 ≈ 1.9 km/s.
Common mistakes:
Using the total shift for one side. If the two sides move in opposite directions, halve the total first.
Forgetting the projection. A shift gives only the component along your line of sight.
The Doppler effect for light is not in the JEE Main 2026 syllabus, but v = c × Δλ/λ uses only ratio and proportion.
What do we know about the flow today?
A review of sunspot magnetic fields by Borrero and Ichimoto in Living Reviews in Solar Physics (2011) describes the Evershed flow as "a nearly horizontal outflow in the photosphere of the penumbra" with typical speeds of 1 to 2 km/s. It concludes that the flow runs in channels where the magnetic field is nearly horizontal, while between them the field is more vertical.
That would have pleased Evershed. In 1909 he called it "somewhat disappointing" that radial motion seemed out of harmony with George Hale's discovery of magnetic fields in sunspots through the Zeeman effect; our post on Pieter Zeeman explains that effect. The two turned out to fit together.
What can a student take from his way of working?
Give up a favourite idea when the data say so. He wrote that the "preconceived conviction that the motion must be circular" was abandoned only after evidence accumulated.
Write down every result, then find one hypothesis that fits all of them. His seven numbered findings did the arguing.
Test your instrument. The oxygen-line check took one extra photograph and removed a whole class of doubt.
If projections and components still feel shaky, the Fermi Problem Library has a step-by-step solver that explains the reasoning, which helps you see where a sine belongs.
Next step: redo step 4 for a spot 30 degrees from the disc centre with the same 1.24 km/s line-of-sight speed.