On this page
Look at the night sky and the stars seem to differ in only two ways: brightness and colour. Plot those two things against each other for many stars, and a pattern appears that tells you how stars are built, how they age and how they die. That plot is the Hertzsprung-Russell (H-R) diagram. This post covers the two people behind it, how to read it, a worked example that uses it to find a star's size, and what their way of working teaches.
Who was Ejnar Hertzsprung?
The obituary by the astronomer K. Aa. Strand (1968) gives his unusual path. Hertzsprung was born near Copenhagen on 8 October 1873. His father loved astronomy but did not want his son to follow it for financial reasons, so Hertzsprung trained as a chemical engineer, graduating in 1898. He worked as a chemist in St Petersburg and studied photochemistry in Leipzig before he began serious astronomy in Copenhagen. Karl Schwarzschild noticed his talent and brought him to Göttingen and then Potsdam. He later moved to Leiden Observatory, which he directed from 1935 until retiring in 1944. He died on 21 October 1967, aged 94.
His chemistry background mattered. He knew photography, and he used photographic plates to measure stars' brightness and colour.
What did Hertzsprung discover?
According to Strand, in papers published in 1905 and 1907, titled "Zur Strahlung der Sterne" (On the radiation of the stars), Hertzsprung showed that among stars as hot as the Sun or cooler, there are two classes that differ strongly in total brightness. These are the giants and the dwarfs. Two stars of the same colour, and so the same surface temperature, can differ hugely in how much light they give off.
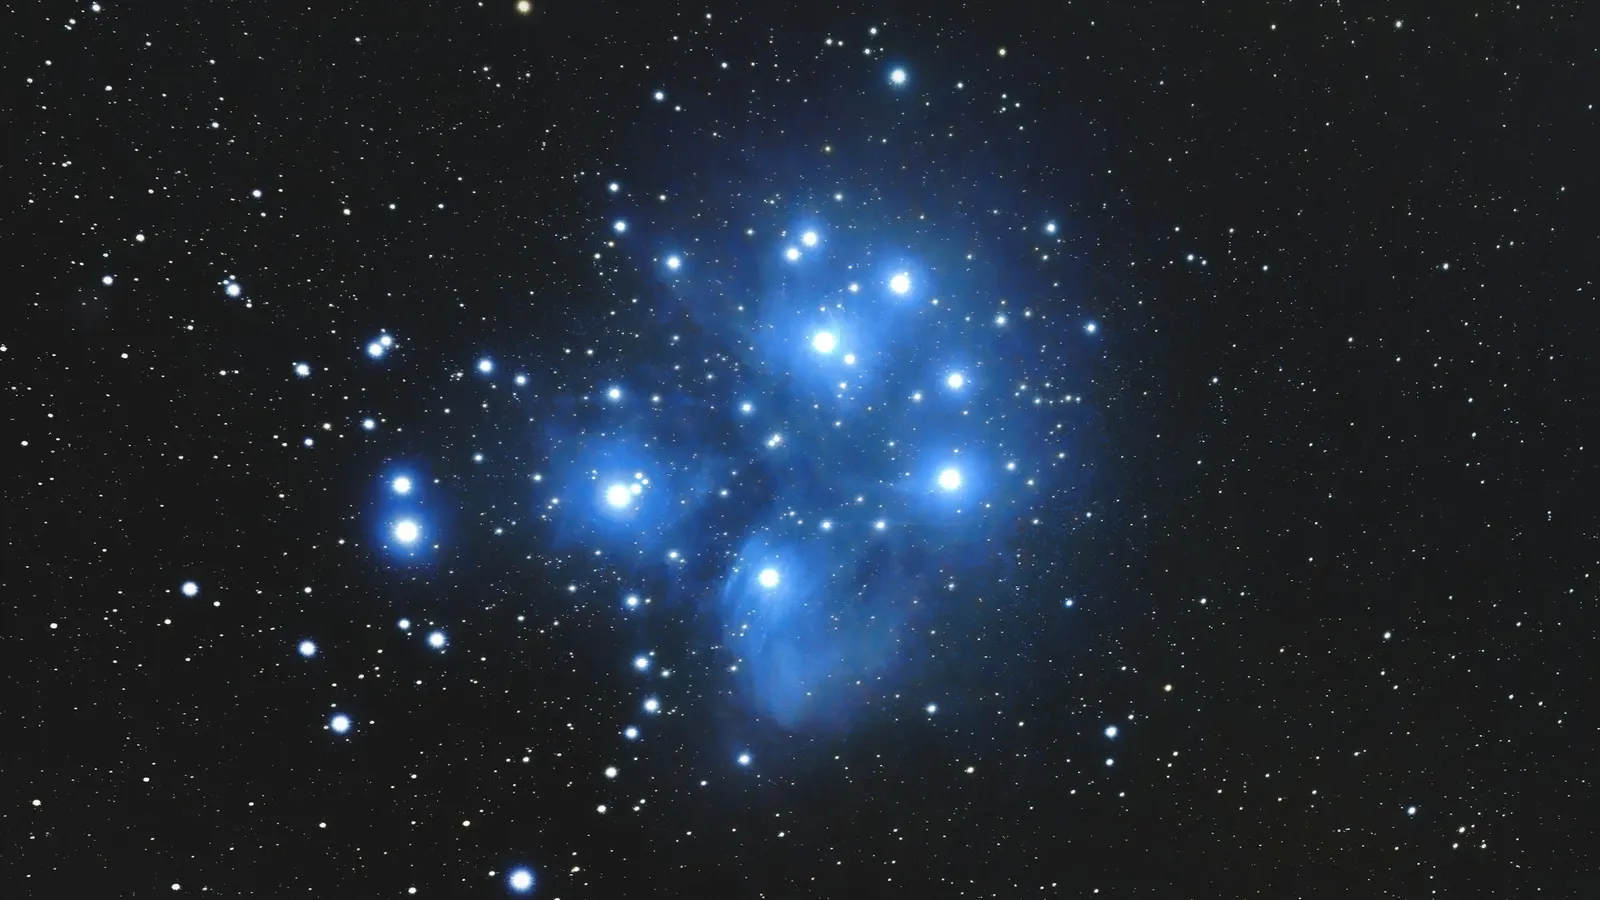
In 1911 he published colour-magnitude diagrams for the Pleiades and Hyades star clusters, which Strand calls the first diagrams of this type. Clusters were a clever choice: all the stars in a cluster are at about the same distance, so their apparent brightness can be compared directly.
What did Russell add?
Henry Norris Russell was born on 25 October 1877 at Oyster Bay, New York, and became director of the Princeton University Observatory in 1912. In a tribute, the astronomer Otto Struve (1957) describes how, at the December 1913 meeting of the American Astronomical Society in Atlanta, Russell read a paper on "Relations Between the Spectra and Other Characteristics of the Stars" to an audience of only twelve astronomical members of the Society. In it he discussed what is now called the Hertzsprung-Russell diagram, noting that Hertzsprung had anticipated some of his results. The paper appeared in Nature in 1914, in parts; the second part is titled "Brightness and Spectral Class". Struve notes that Russell's work on stellar evolution, and Eddington's, grew from this diagram.
How do you read an H-R diagram?
Horizontal axis: temperature (or colour, or spectral type), with hot blue stars on the left and cool red stars on the right. Temperature decreases to the right.
Vertical axis: luminosity, the total power a star emits, increasing upwards.
Main sequence: the diagonal band from hot and bright to cool and dim. Most stars, including the Sun, spend most of their lives here.
Giants: upper right, cool but very bright, so they must be large.
White dwarfs: lower left, hot but dim, so they must be small.
The Gaia Collaboration's 2018 paper on Hertzsprung-Russell diagrams explains that a star's position is set mainly by its initial mass, chemical composition and age. Using Gaia data for about 1.3 billion sources, it showed for the first time a clear split of the white dwarf sequence into hydrogen and helium white dwarfs.
Worked example: how big is a giant?
The Stefan-Boltzmann law gives luminosity: L = 4πR²σT⁴. Comparing a star with the Sun, the constants cancel:
R/R_Sun = √(L/L_Sun) × (T_Sun/T)².
Use the nominal solar temperature T_Sun = 5772 K from IAU 2015 Resolution B3.
A cool giant: T = 4000 K, L = 100 L_Sun.
√100 = 10.
5772/4000 = 1.443, and 1.443² ≈ 2.082.
R ≈ 10 × 2.082 ≈ 20.8 R_Sun.
A white dwarf: T = 10,000 K, L = 0.01 L_Sun.
√0.01 = 0.1.
5772/10,000 = 0.5772, and 0.5772² ≈ 0.333.
R ≈ 0.1 × 0.333 ≈ 0.033 R_Sun. With the IAU nominal solar radius of 695,700 km, that is about 23,000 km, only a few times the size of the Earth.
Common mistakes:
Reading the temperature axis the wrong way. Hot is on the left.
Using T instead of T⁴. Luminosity depends on the fourth power of temperature. In the ratio form it becomes (T_Sun/T)² after the square root.
Mixing up magnitude and luminosity. On a magnitude scale, a smaller number means brighter.
Our post on black body radiation covers the Stefan-Boltzmann law in more depth, and the stories of Annie Jump Cannon and Cecilia Payne explain the spectral classes on the horizontal axis. If the T⁴ dependence is hard to picture, the Fermi Simulation Lab has interactive simulations for ideas that are easier to see than read.
What can a student take from their way of working?
Bring skills from another field. Hertzsprung's chemistry and photography made his star measurements possible.
Choose a clever sample. Clusters removed the distance problem at a stroke.
Plot your data. A simple graph of two quantities revealed a pattern no table showed.
Be patient. In his 1929 George Darwin Lecture, quoted by Strand, Hertzsprung explained why he measured faint Pleiades stars that would be easier to measure in a hundred years: "My answer is that I cannot wait as long as that, and my only excuse, human impatience and curiosity."
Try it now: use the same formula to find the radius of a star with T = 3000 K and L = 0.04 L_Sun, and decide where it sits on the diagram.