

On this page
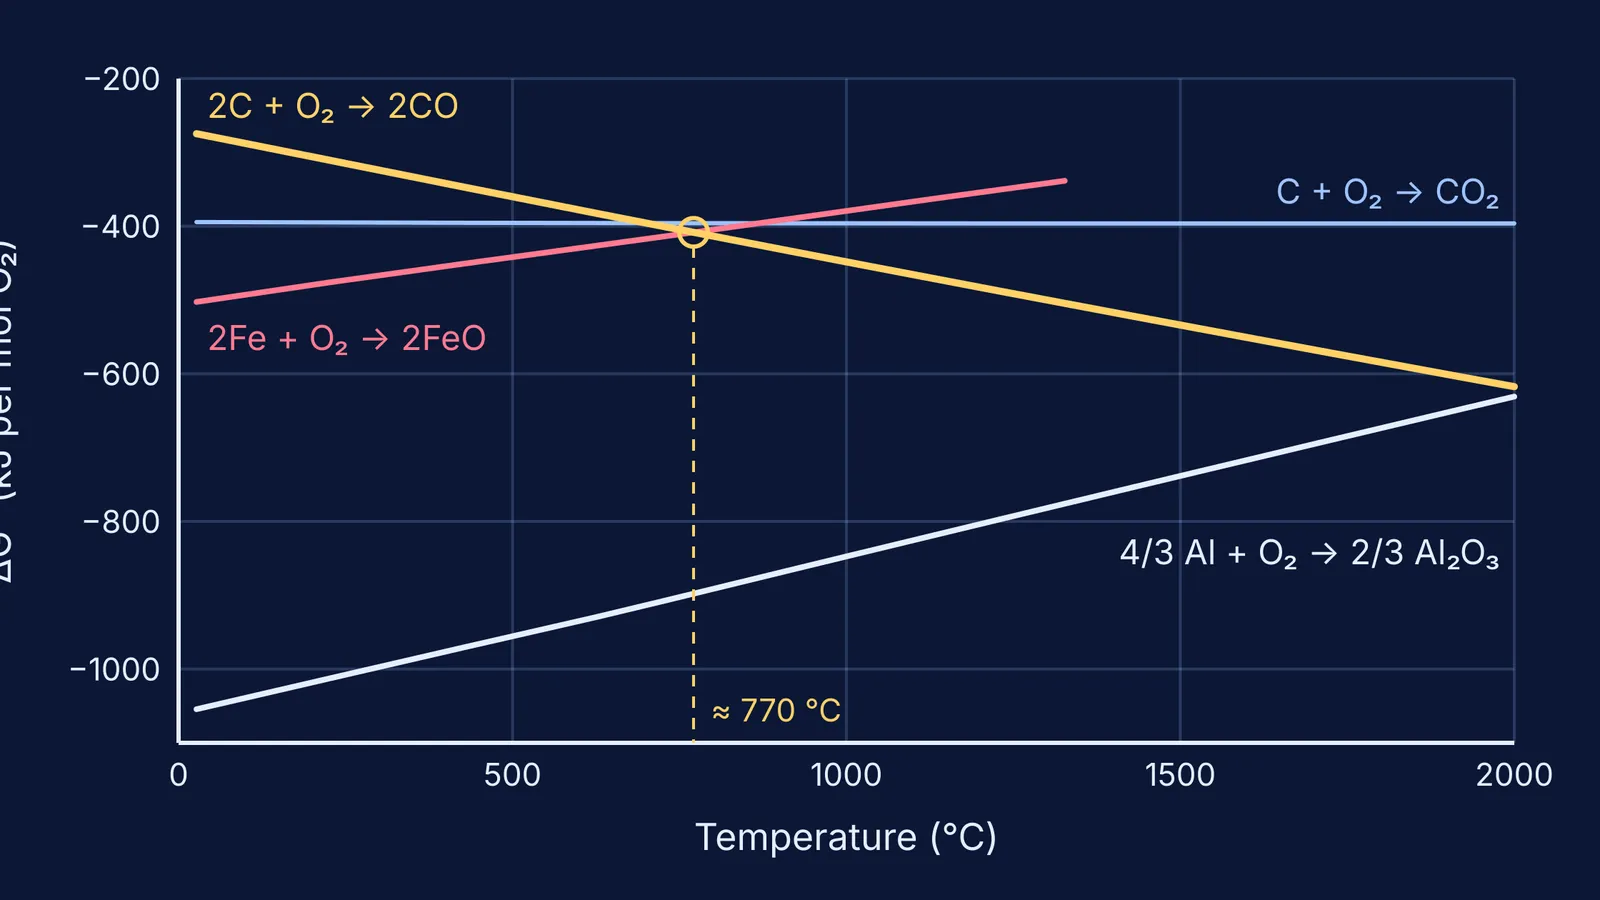
In 1944 a London chemist put a pile of thermodynamic data onto a single graph. Harold Ellingham's chart shows at a glance whether carbon can pull iron out of its ore, and why it cannot do the same for aluminium.
Who was Harold Ellingham?
Harold Johann Thomas Ellingham was born in Tottenham on 21 November 1897 and died in Harrow on 19 December 1975, according to his Wikipedia biography. He studied at the Royal College of Science in London, served with the Royal Engineers in Mesopotamia and India, and returned as a demonstrator in 1919. He became reader in physical chemistry in 1937, and from 1944 to 1963 he was secretary of the Royal Institute of Chemistry.
How did Harold Ellingham create the Ellingham diagram?
His paper, "Reducibility of oxides and sulphides in metallurgical processes", appeared in the Journal of the Society of Chemical Industry, volume 63, starting on page 125 (biography). The May 1944 issue section that contains it, pages 125 to 160, has its own DOI record.
For any reaction, the standard Gibbs energy change is ΔG° = ΔH° − TΔS°. If you plot ΔG° against temperature T, you get a line with intercept ΔH° and slope −ΔS°. (If that equation is rusty, our post on Gibbs energy and spontaneity works through it.)
Ellingham's key step was to scale every oxide-forming reaction to one mole of oxygen, so that the stability of many different oxides could be compared on the same diagram, his biography notes. Most charts use one mole of O₂ (some textbooks use one mole of O atoms, says the Ellingham diagram article), which is why the iron line is written 2Fe + O₂ → 2FeO and the aluminium line as 4/3 Al + O₂ → 2/3 Al₂O₃.
Three features follow:
The lines are nearly straight, because ΔS° changes little with temperature, apart from kinks at melting or boiling points.
Metal oxide lines slope upwards: a gas (O₂) is used up, so ΔS° is negative and −ΔS° is positive. Since that entropy loss is similar for most metals, the lines run roughly parallel (source).
The line for 2C + O₂ → 2CO slopes downwards, because one mole of gas becomes two. It crosses the CO₂ line near 700 °C, above which CO is the dominant oxide of carbon (source).
How do you read an Ellingham diagram?
A substance is a reducing agent for a metal when the free energy change for its own oxidation is more negative than the free energy change for oxidising that metal, says the University of Cambridge's DoITPoMS tutorial on reducing agents. On the chart, a lower line can take oxygen from a higher one.
Where two lines cross, the two reactions have equal ΔG°, the system is at equilibrium, and the roles swap on either side of that temperature. The same tutorial gives a steelmaking example: for 3C + 2Fe₂O₃ → 3CO₂ + 4Fe, ΔG° is negative only above 1020 K. For the Class 10 groundwork, see our guide to extracting metals by roasting, calcination and reduction.
Worked example: can carbon reduce FeO and Al₂O₃?
We drew the hero chart from the NIST-JANAF tables of ΔfG° for CO, CO₂, FeO and Al₂O₃. Doubling the CO and FeO values, and taking two-thirds of the Al₂O₃ value, puts each reaction per mole of O₂.
At 1000 K: 2C + O₂ → 2CO has ΔG° = −400.6 kJ, and 2Fe + O₂ → 2FeO has ΔG° = −413.9 kJ.
Subtract to get 2FeO + 2C → 2Fe + 2CO: ΔG° = −400.6 − (−413.9) = +13.3 kJ. Not yet.
At 1100 K: the carbon line is at −418.2 kJ and the iron line at −401.3 kJ, so ΔG° = −16.9 kJ. Now carbon wins.
Interpolating, the lines cross at about 1044 K, roughly 770 °C, for pure substances in their standard states.
Now aluminium. At 2000 K the carbon line is at −572.1 kJ but the aluminium line is at −689.4 kJ, so 2/3 Al₂O₃ + 2C → 4/3 Al + 2CO has ΔG° = +117.3 kJ. Even at 2000 °C, the right edge of our chart, the carbon line stays above aluminium's. That gap helps explain why aluminium is made by electrolysis instead, the story told in our post on Hall, Héroult and cheap aluminium.
A four-step check for any Ellingham question
Write both oxidation reactions for one mole of O₂.
At the stated temperature, find which line is lower. Lower is the reducer.
For the reduction reaction, ΔG° = (reducer's line) − (metal's line). Negative means it can go.
Look for a crossing point and any kink, where a phase change alters ΔS°.
If you tend to subtract the lines the wrong way round in step 3, the Fermi Problem Library has worked problems with a step-by-step solver that explains the reasoning rather than printing an answer. If ΔG° itself feels shaky, the Fermi Concept Library gives each concept its own lesson and its place in the map.
Try it yourself: find where the carbon and iron lines cross on the hero chart, then compare with the worked example.


