On this page
It is easy to think of wildlife science as dramatic moments caught on camera. George Schaller's work shows it is mostly something quieter: months of watching, counting and writing things down, then doing simple arithmetic on what you recorded. This post covers his main studies and works through some of his real field numbers.
Who is George Schaller?
The Academy of Achievement's profile of Schaller says he was born in Berlin on 26 May 1933 and moved to the United States after the Second World War, arriving in Missouri in 1947. There, as a teenager, he kept a pet raccoon and collected snakes and lizards. He studied at the University of Wisconsin, finishing a master's degree in 1957 and a doctorate in zoology in 1962. In 1966 he joined the New York Zoological Society, now the Wildlife Conservation Society.
What did he learn from the mountain gorillas?
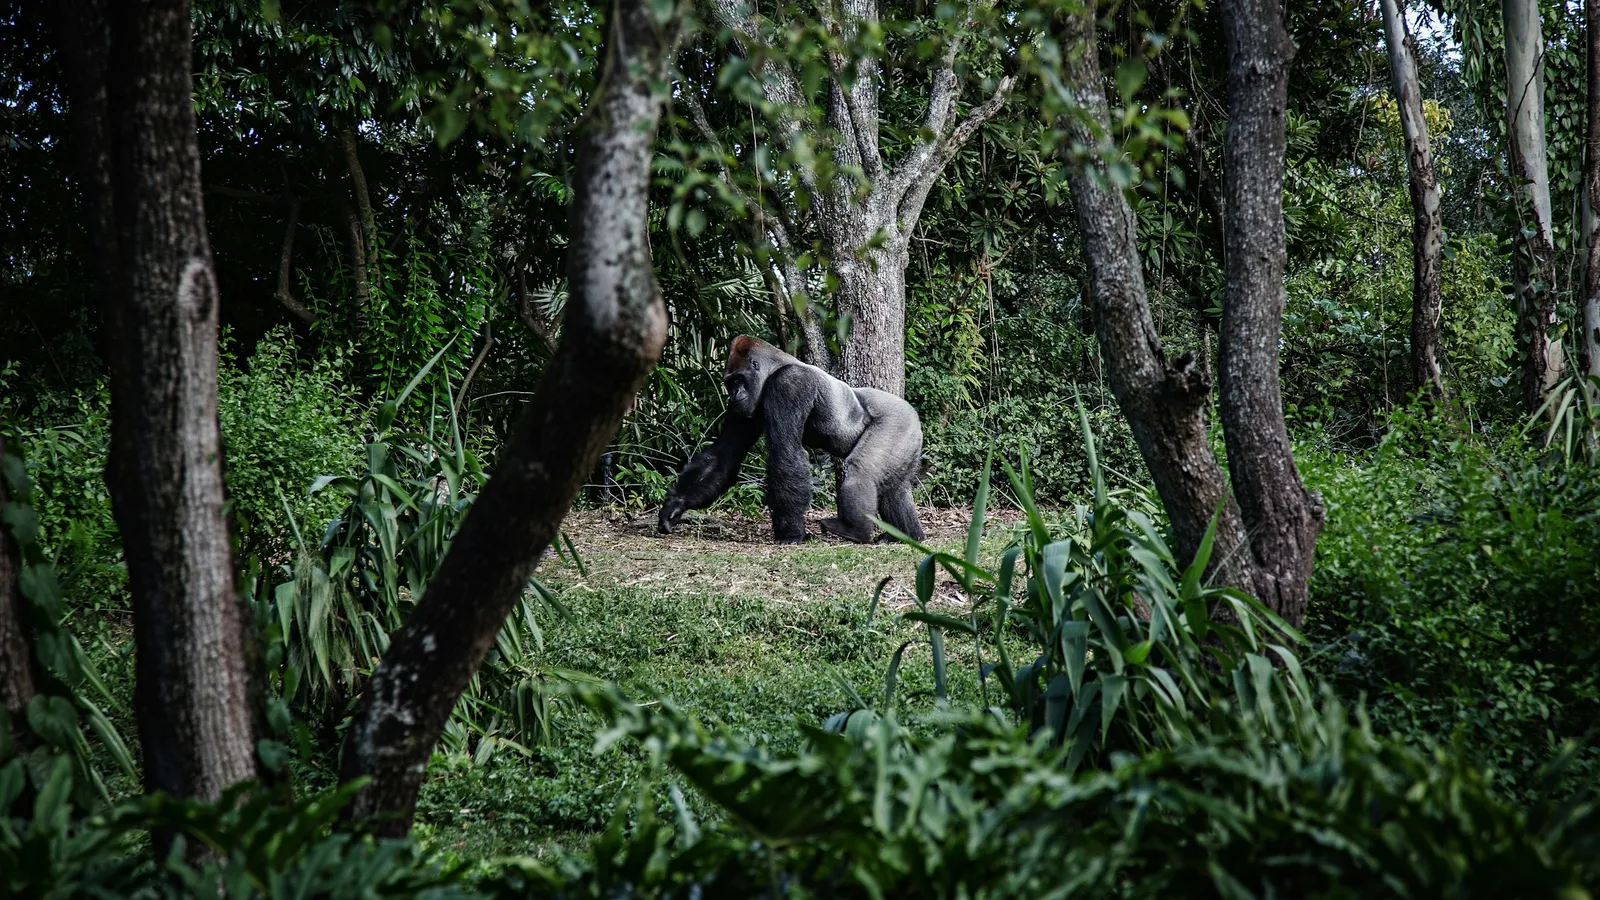
In 1959 and 1960, the profile says, Schaller and his wife Kay lived in the Virunga volcanoes to carry out the first intensive study of mountain gorillas. Popular images then showed gorillas as violent. After a year of close observation, the Schallers found them far gentler and more cooperative than that. He described the work in The Mountain Gorilla (1963) and, for general readers, The Year of the Gorilla.
His method mattered as much as his findings. The profile notes that he refused to carry a firearm near the animals, believing that a person who keeps a regular, quiet routine can earn their tolerance.
Why did he come to India?
The gorilla study, says the same profile, led the Government of India to invite him to study the Bengal tiger. From 1963 to 1965 the family lived in a bungalow in Kanha National Park in central India. His 1967 book, The Deer and the Tiger, describes the ecology and behaviour of tigers and four species of hoofed animals they hunt.
The key idea was that you cannot understand a predator without its prey. Counting deer and noting what tigers killed told him as much as watching the tigers themselves. For India's earlier tiger history, read about Jim Corbett, whose name is on the first national park.
How do you turn field notes into numbers?
From 1966 to 1969 Schaller worked in Tanzania's Serengeti National Park. His book The Serengeti Lion won the National Book Award in Science, according to the profile. He also studied cheetahs, and his 1968 paper on cheetah hunting behaviour in the Serengeti is a good example of simple numbers from careful watching. Its summary reports:
89% of 136 cheetah kills were Thomson's gazelles.
One female cheetah captured 24 Thomson's gazelles in 26 days, a killing rate of 10 kg per day.
Her actual food intake was about 4 kg per day.
Hunting success on large subadult and adult gazelles was about 50%.
12% of kills were taken over by lions and hyenas.
Here is a worked example using those figures.
How many gazelle kills? 89% of 136 = 0.89 × 136 ≈ 121 kills.
How much prey did the female kill? 10 kg per day × 26 days = 260 kg.
How big was an average gazelle she killed? 260 kg ÷ 24 gazelles ≈ 10.8 kg each. The paper also notes that 54% of the gazelle kills were subadults, so many of these were young animals.
What fraction did she eat? 4 kg per day × 26 days = 104 kg eaten. 104 ÷ 260 = 0.40, so about 40% of what she killed.
How many kills were lost to other predators? 12% of 136 = 0.12 × 136 ≈ 16 kills.
What mistakes do students make with field data like this?
Mixing rates and totals. "10 kg per day" is a rate. Multiply by the number of days before comparing with a total.
Applying one animal's figures to all. The 24-in-26-days figure is for one female. Treat it as an example, not a species average.
Rounding too early. Keep 10.8 kg until the end of a calculation; rounding to 11 kg and then multiplying adds error.
Forgetting the denominator. 89% and 12% are both percentages of 136 kills, not of each other.
What can a student take from Schaller's way of working?
Schaller's studies show that good science often starts with patience and a notebook. He lived near the animals, watched for months, and turned behaviour into numbers others could check. You can practise the same method on a small scale: a week of counting birds at a feeder, ants carrying food or visitors to a flowering plant, then calculating rates per hour and per day. For the wider picture of why species and habitats matter, read about E. O. Wilson and biodiversity.
If percentages and rates like these trip you up, the Fermi Problem Library has worked problems with a step-by-step solver that explains the reasoning, so you can check each step of your method.
Choose one animal you can watch for fifteen minutes a day this week, count one behaviour, and work out its rate per hour on Sunday.