

On this page
Inside your inner ear is a coiled tube, the cochlea, and running along it is a thin strip called the basilar membrane. For decades scientists argued about how that strip moves when sound arrives. Georg von Békésy settled it by watching.
Who was Georg von Békésy?
According to his Nobel Prize biography, Békésy was born in Budapest on 3 June 1899 and earned a PhD in physics from the University of Budapest in 1923. At the Hungarian Post Office's research laboratory he worked mainly on long-distance telephone transmission, and came to study the ear as a main component of the transmission system. He moved to Harvard's Psycho-Acoustic Laboratory in 1947 and died on 13 June 1972.
The 1961 Nobel Prize in Physiology or Medicine went to him alone, "for his discoveries of the physical mechanism of stimulation within the cochlea".
What did Békésy see inside the cochlea?
In his Nobel lecture, Békésy described touching the stem of a tuning fork to threads, chains, springs, membranes, human skin and fluid surfaces and watching them under a stroboscope. If the frequency was high enough, every object with internal elasticity showed travelling waves. He saw no physical reason the basilar membrane should be different; publishing this in a physics journal would have been ridiculous, he said, because "to a physicist this was obvious".
He then worked on fresh human temporal bones and animal ears, and spent 4 or 5 months developing cements that would stick to bone under water. The presentation speech explains that he used high-magnification stroboscopic microscopy to see membrane movements measured in thousandths of a millimetre.
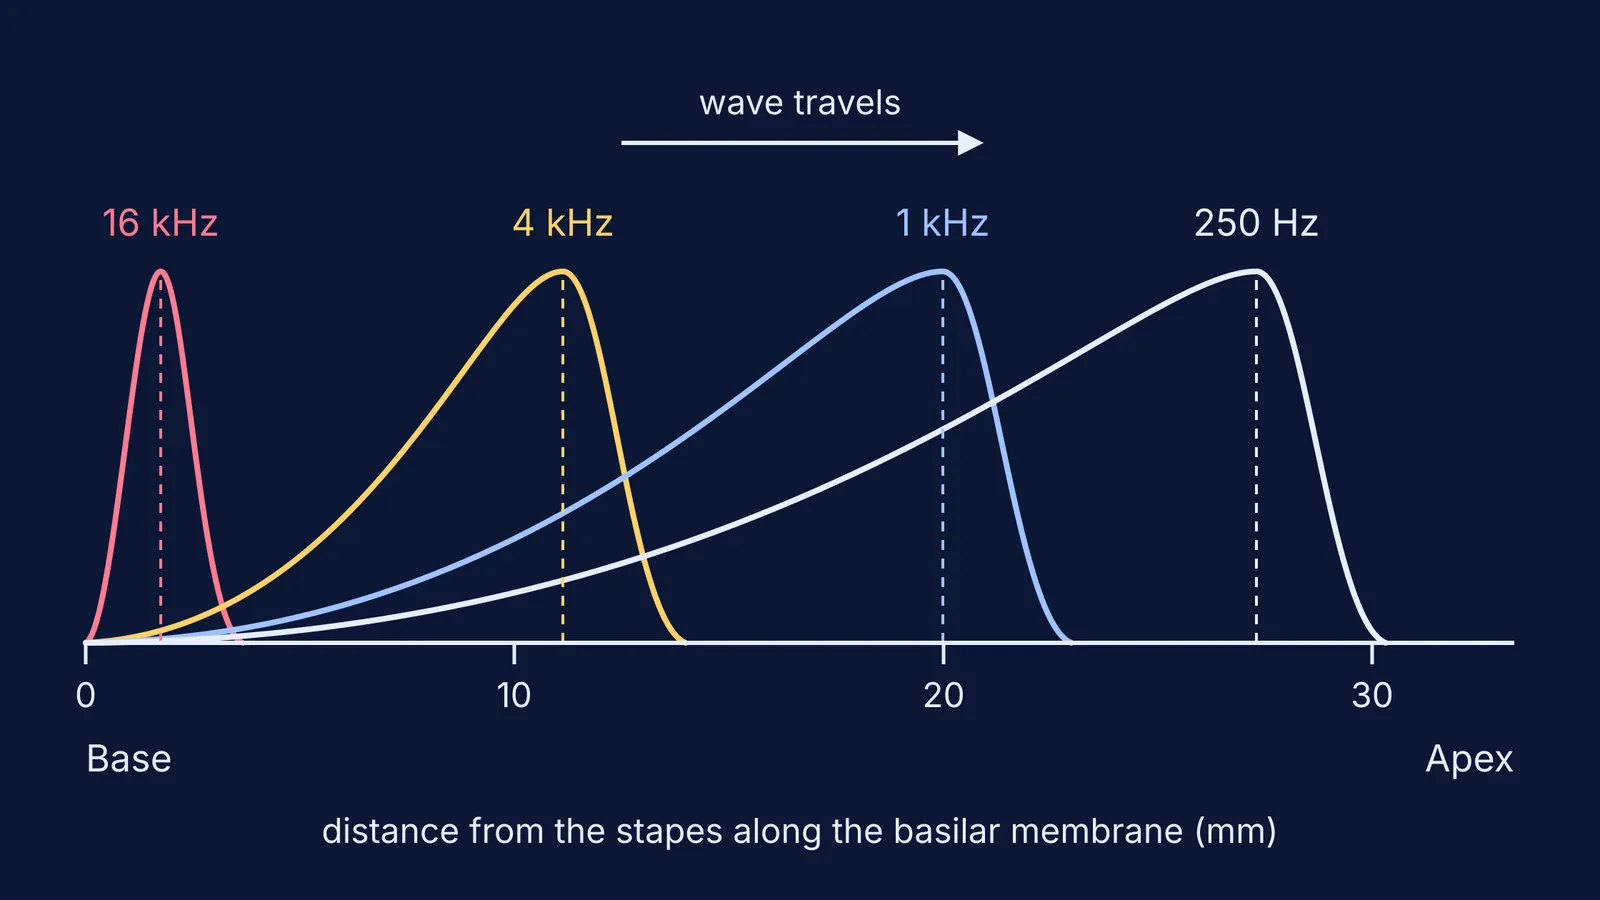
What he saw, in the words of that speech: movements of the stirrup footplate set up a wave that travels from the stiffer base of the cochlea to the more flexible apex. The crest first grows, then quickly shrinks. The highest crest appears near the apex for low tones and near the base for high tones.
Why does each pitch peak at a different place?
The membrane is not uniform. Békésy's lecture says its elastic properties change continuously from very stiff to very soft. In simple terms, a wave grows as it travels until it reaches the part of the membrane that responds best to its frequency, peaks there and then fades. High frequencies peak in the stiff region near the base; low frequencies run further, towards the soft apex.
The US National Institute on Deafness and Other Communication Disorders puts the result simply: hair cells near the wide end of the snail-shaped cochlea detect higher-pitched sounds, and those closer to the centre detect lower-pitched sounds.
How do you work out where a tone peaks?
A later formula linking place and pitch is the Greenwood function. For the human cochlea, Sridhar and colleagues (2006) give it as F = 165.4 × (10^(2.1x) − 0.88), where x is the position along the membrane as a fraction of its length, measured from the apex (x = 0 gives about 20 Hz). Donald Greenwood's 1990 paper showed the same basic function fits newer data from human cadaver ears and from living animal preparations.
Worked example: where does a 1,000 Hz tone peak?
Divide by 165.4: 1000 ÷ 165.4 = 6.05.
Add 0.88: 6.93.
Take log base 10: 0.84.
Divide by 2.1: x = 0.40, so the peak sits 40% of the way from the apex.
Sridhar's team found a mean organ of Corti length of 33.31 mm in seven human cochleae, so the peak is about 13.3 mm from the apex, or about 20 mm from the stapes.
Run the same steps and 4,000 Hz peaks about 11 mm from the stapes, while 16,000 Hz peaks under 2 mm from it. Try 250 Hz yourself; you should get about 27 mm from the stapes.
If waves still feel abstract, the Fermi Simulation Lab has interactive simulations for ideas that are easier to see than to read. Our post on displacement and pressure waves in sound covers what the air is doing before it reaches your ear.
What did later research add?
Békésy measured human ears after death, and his lecture notes that the maximum he saw was relatively flat. A 2001 review by Robles and Ruggero explains that in normal living cochleae, especially near the base, responses to soft sounds near a spot's best frequency are sensitive and sharply tuned, thanks to a "cochlear amplifier" driven by the outer hair cells. That amplifier is highly labile, which helps explain why the peaks Békésy measured looked flatter.
The core of Békésy's picture still stands: each place on the membrane responds best to one frequency. For how that map shaped hearing devices, see Graeme Clark and the multichannel cochlear implant.
To see where this sits among other ideas about hearing and waves, the Fermi Concept Library gives each concept its own lesson and its place in the map.


