On this page
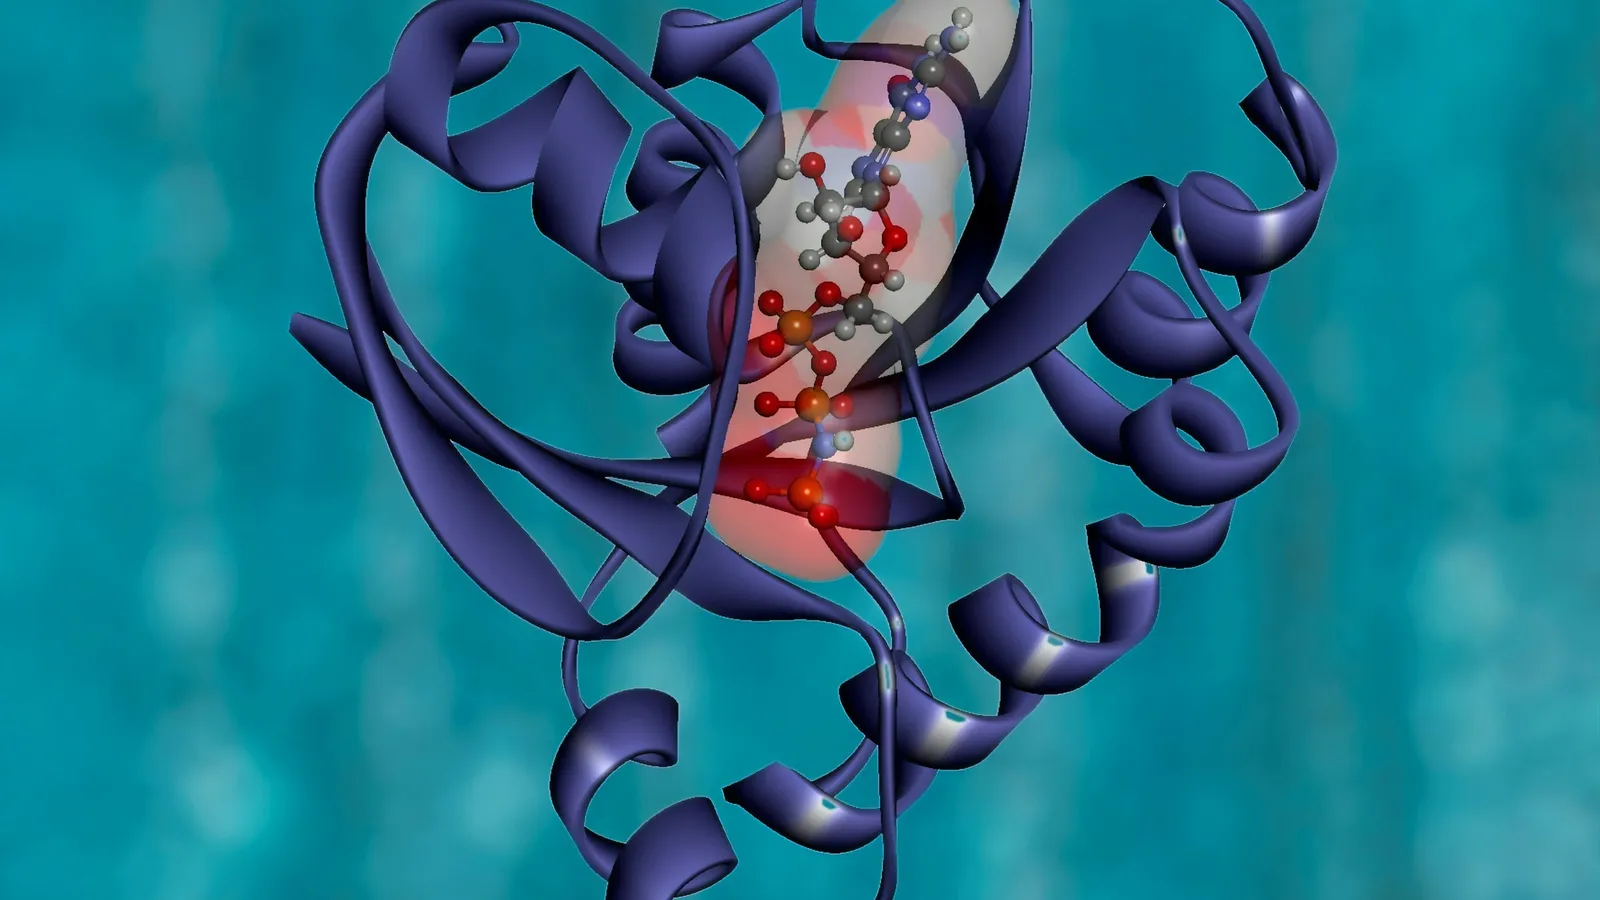
Every protein is a chain of amino acids that folds into a precise shape, and the shape decides what the protein does. In the 1950s and 1960s nobody could yet see most of those shapes. G. N. Ramachandran, working in Madras, used geometry and physics to work out which shapes were possible at all. This post explains his two big ideas and how to read the plot named after him.
Who was G. N. Ramachandran?
A remembrance by his colleague C. Ramakrishnan, published in Protein Science in 2001, gives the outline. Gopalasamudram Narayana Iyer Ramachandran was born on 8 October 1922 at Ernakulam in Kerala. He took a master's degree in physics from Madras University in 1942 and did research at the Indian Institute of Science under C.V. Raman, whose work we cover in our post on Raman scattering. He later earned a PhD at Cambridge.
Around 1952 he moved to Madras University, where most of his crystallography and biophysics was done. In 1970 he returned to IISc and founded the Molecular Biophysics Unit. He died in Chennai on 7 April 2001. Ramakrishnan notes that his honours included the Shanti Swarup Bhatnagar Award, Fellowship of the Royal Society and the Ewald Prize of the International Union of Crystallography.
How did he arrive at collagen's triple helix?
Collagen is the main structural protein of tendons, skin and bone. After a visit to Madras by the crystallographer J.D. Bernal, Ramachandran decided to work out collagen's structure from existing X-ray data. With Gopinath Kartha he published Structure of collagen in Nature in 1954, followed by a revised model in 1955.
The key observation, Ramakrishnan writes, was that glycine makes up one third of collagen's amino acids and is crucial for packing three chains closely with good hydrogen bonds. Glycine is the smallest amino acid; its side chain is a single hydrogen atom, so it fits where nothing larger could. In the triple helix, the glycines face the centre.
The model was challenged. Alexander Rich and Francis Crick had proposed a slightly different structure and argued that some atoms in Ramachandran's model were too close together. V. Sasisekharan checked crystal structures of amino acids and peptides and showed that such short distances do occur. That argument about how close atoms can get led straight to the next idea.
What is a Ramachandran plot?
Each amino acid in a protein backbone has two bonds that can rotate. The angle around the N to C-alpha bond is called phi, and the angle around the C-alpha to C bond is called psi. The peptide unit between residues is planar and does not rotate freely; Ramachandran started from its dimensions as worked out by Linus Pauling.
So the local shape of a chain at each residue is described by just two numbers, phi and psi, each running from −180° to +180°. Ramachandran's question was: which pairs are physically possible?
In Stereochemistry of polypeptide chain configurations, published in the Journal of Molecular Biology in 1963 with Ramakrishnan and Sasisekharan, the team treated atoms as having minimum contact distances and checked which angle pairs make atoms collide. Ramakrishnan recalls that, with no computers in India at the time, the calculations were done on electronic desk calculators.
A worked example of the plot's logic
Here is how the plot made a prediction. Around 1964 Ramachandran received the phi and psi angles of residues in the non-helical regions of myoglobin, one of the first protein structures solved. All but two residues fell inside the allowed regions of his map.
Observation: two residues sat in regions forbidden for ordinary amino acids.
Reasoning: glycine has only a hydrogen as its side chain, so it clashes with less and has larger allowed regions. He checked the two outliers against the separate map for glycine, and they fitted.
Prediction: if the map is right, those two residues must be glycine.
Test: he wrote to H.C. Watson at the MRC in Cambridge. Both were glycine.
Later, structures of myoglobin and lysozyme showed residues in a gap between the helix and sheet regions. Rather than just redraw the map, he had the contact distances in that region recalculated, found the clashes were marginal, and called it the "bridge region".
What can a student take from his way of working?
Start from first principles. He began with bond lengths, angles and atomic sizes, not with a guess about the answer.
Make a picture that compresses the problem. The plot turns a three-dimensional folding problem into a two-dimensional map you can read at a glance.
Let your model make risky predictions. The glycine test could have proved him wrong.
Take objections seriously. The Rich and Crick criticism pushed his group to check contact distances properly, and that check became the plot.
Protein structure appears in the biomolecules chapters of school chemistry and biology; our guide to biomolecules in chemistry covers primary to quaternary structure. Molecules are easier to understand when you can turn them around, and the Fermi Simulation Lab has interactive simulations for ideas that are easier to see than to read.
Take a pencil and sketch two peptide units joined at one carbon, then mark the two bonds that can rotate.