

On this page
The human heart is two pumps connected in series. The right ventricle sends blood to the lungs, and the left ventricle sends it to the rest of the body. If the right side pumped even a fraction more than the left on every beat, blood would quickly pool in the lungs.
How do the two sides stay perfectly synchronised, beat after beat, without a nervous system controller constantly measuring the flow?
The answer lies in the muscle itself, described by the Frank-Starling law of the heart.
What is the Frank-Starling law of the heart?
The Frank-Starling law states that the stroke volume of the heart increases in response to an increase in the volume of blood in the ventricles, before contraction (Wikipedia).
In clinical terms, as the volume of blood filling the heart before a beat increases, the muscle fibers are stretched further. The heart automatically responds by contracting more forcefully to eject the extra blood. This ensures the heart pumps out exactly whatever volume of blood returns to it.
Two physiologists described this relationship. In 1895, the German physiologist Otto Frank observed in isolated frog hearts that changing the filling volume altered the contraction pressure. In 1914, the British physiologist Ernest Henry Starling extended this to intact mammalian hearts using a canine preparation.
Starling captured the principle in his 1915 Linacre Lecture: "The mechanical energy set free in the passage from the resting to the active state is a function of the length of the fiber" (Wikipedia).
How do sliding filaments explain the law?
How does stretching a muscle make its next contraction stronger? The answer was found decades later, in the 1960s, by looking at the heart's microscopic machinery.
Cardiac muscle cells contain sarcomeres, which are made of thick (myosin) and thin (actin) filaments. When a muscle contracts, these filaments slide over each other. According to the sliding filament model, stretching the sarcomere increases the overlap between actin and myosin, allowing more cross-bridges to form.
Research shows that maximal force in the human heart is generated at an optimal initial sarcomere length of 2.2 micrometers (Wikipedia). Stretching the fibers also makes the muscle proteins more sensitive to calcium ions, which are the trigger for the contraction.
If you find it difficult to picture these microscopic movements from a textbook description, interactive models can help. The Fermi Simulation Lab has interactive simulations for the ideas that are easier to see than to read, allowing you to stretch virtual sarcomeres and watch how the overlapping filaments and calcium sensitivity alter the resulting force.
How does the curve shift in heart failure?
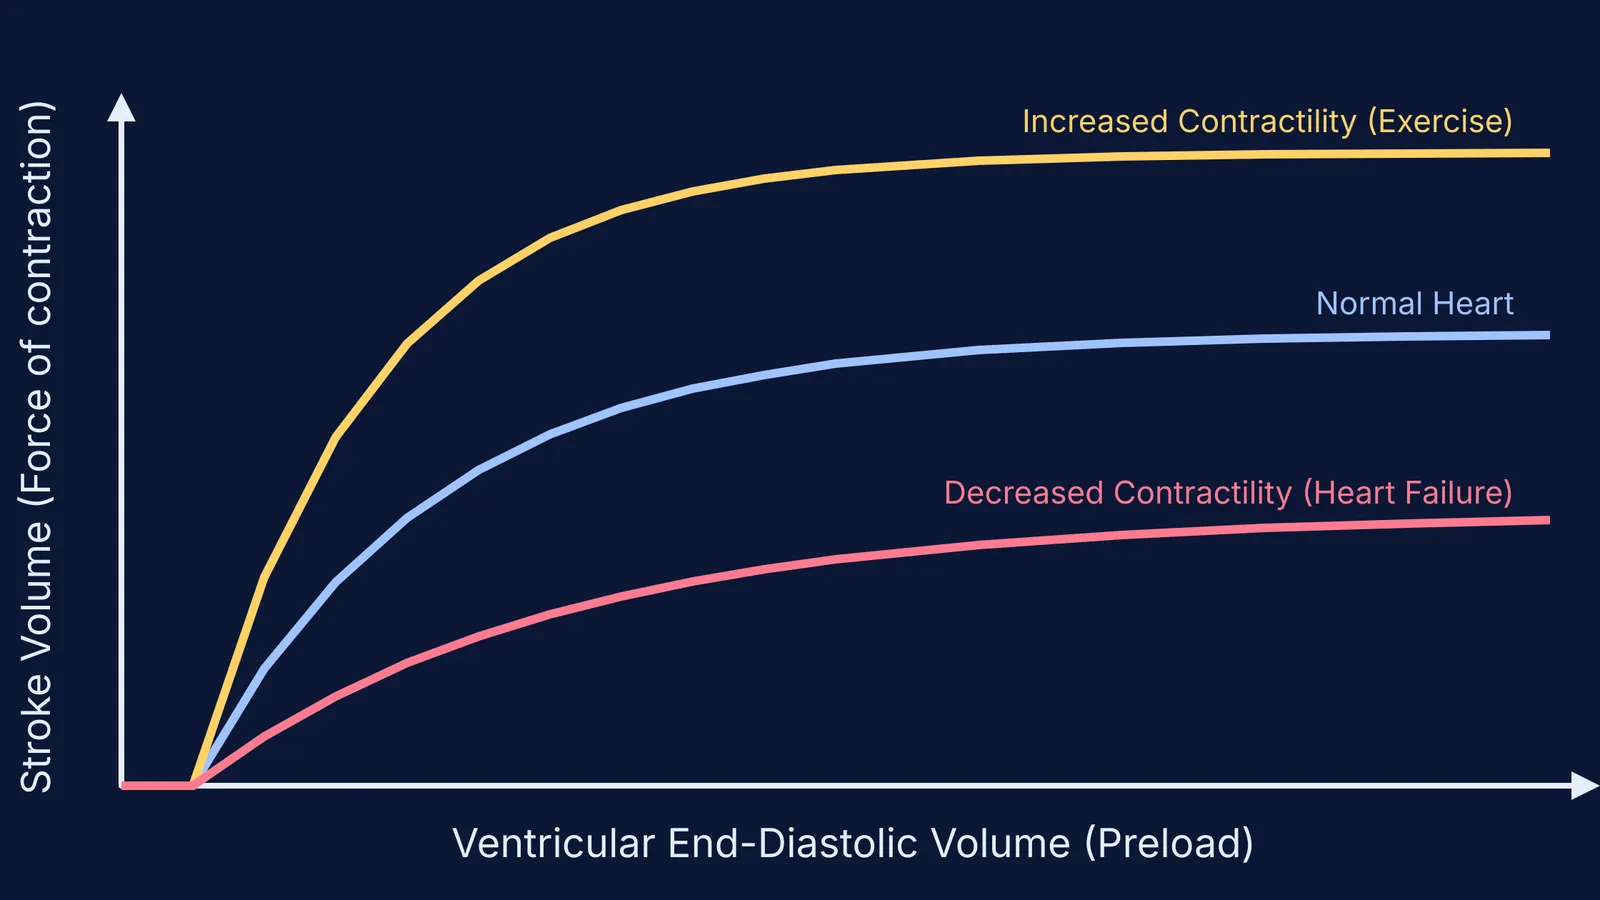
The Frank-Starling mechanism is often drawn as a curve plotting the filling volume (end-diastolic volume) on the horizontal axis against the stroke volume on the vertical axis. Normally, the curve goes steeply up and then plateaus.
However, the curve's shape changes based on the heart's intrinsic health:
During exercise: Nerves increase the heart's baseline contractility. The curve shifts upward and to the left, meaning the heart pumps a much larger stroke volume for the exact same filling pressure.
In heart failure: The heart muscle weakens, and the curve shifts downward and flattens out. In severe heart failure, the ventricular performance curve may be nearly flat at higher diastolic volumes (StatPearls). The heart requires a much higher filling pressure to achieve a normal stroke volume, which eventually causes fluid to back up into the lungs.
How do you calculate stroke volume?
For students tackling cardiovascular physiology, you often need to calculate these values numerically. The foundational equation is:
Stroke Volume (SV) = End-Diastolic Volume (EDV) − End-Systolic Volume (ESV)
A worked example (Wikipedia):
A patient's ventricle fills to an EDV of 140 mL.
The heart contracts and ejects blood, leaving an ESV of 50 mL.
The stroke volume is 140 mL − 50 mL = 90 mL.
If venous return suddenly increases the EDV to 160 mL, the Frank-Starling law ensures the contraction is stronger. If the ESV remains 50 mL, the new stroke volume is 110 mL. The output perfectly matches the new input.
For more complex scenarios where afterload and contractility change simultaneously, the Fermi Problem Library has worked problems with a step-by-step solver that explains the reasoning rather than printing an answer.
Before they flow through the heart, the cells carrying oxygen must be formed. You can review the details in our guide to the Formed elements of blood: RBCs, WBC types and platelets for NEET.


