

On this page
If you pick a set of numbers from the real world—such as the populations of cities, the lengths of rivers, or the surface areas of lakes—you might expect the first digits of those numbers to be evenly spread. It feels intuitive that a number is just as likely to start with a 9 as it is with a 1.
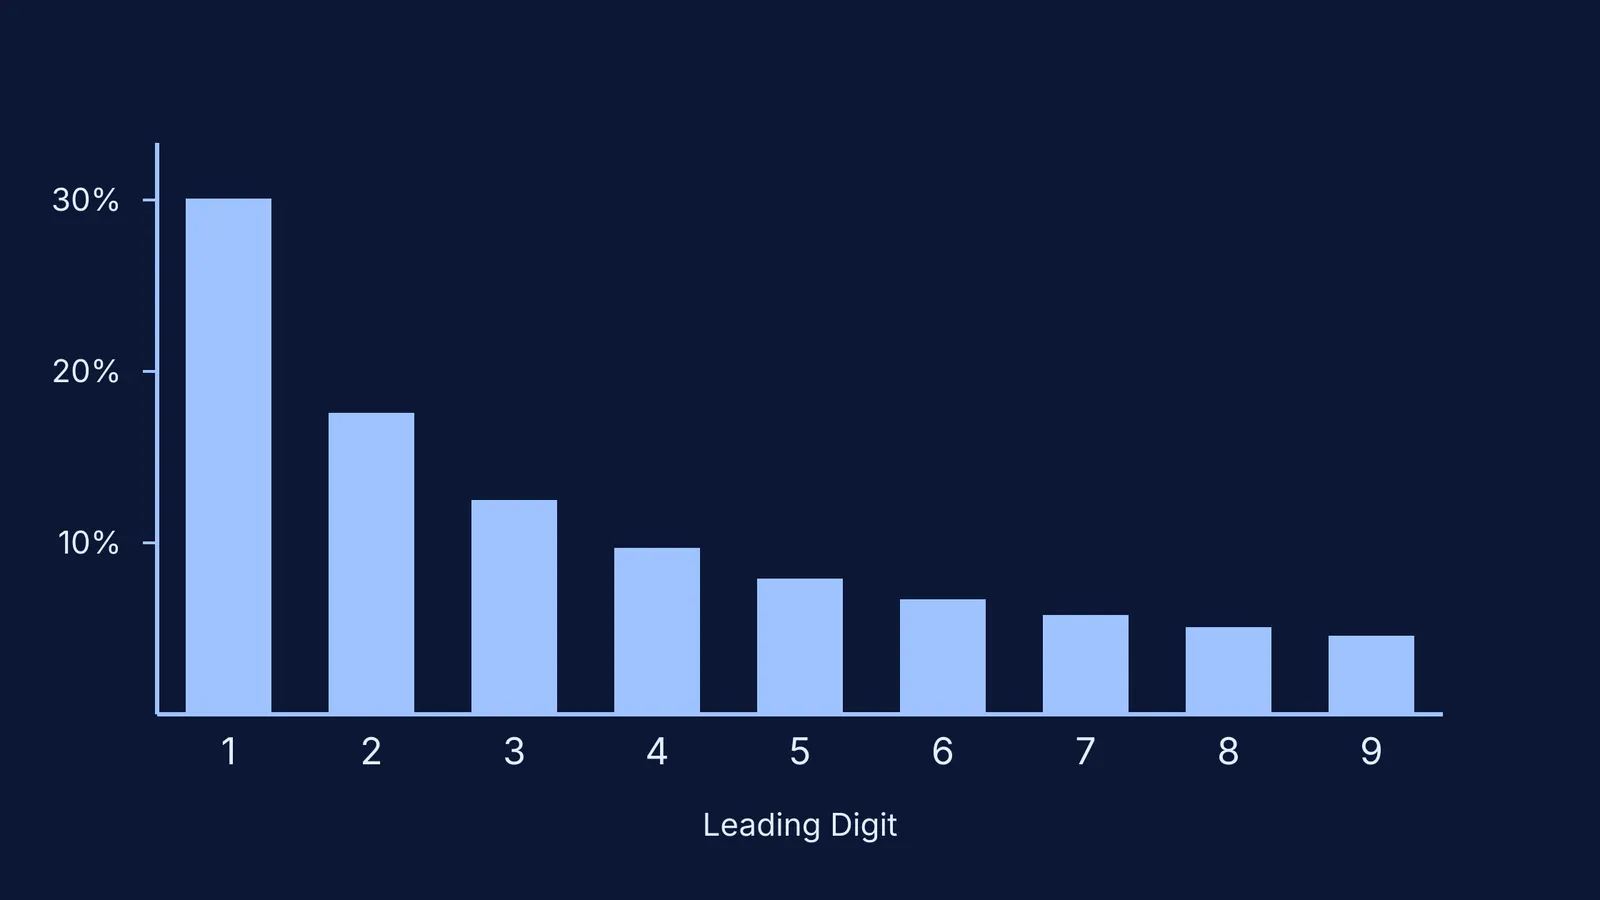
But if you look at the data, a strange pattern emerges. The digit 1 appears as the first digit about 30.1% of the time (source), while the digit 9 appears less than 5% of the time. This phenomenon, which defies everyday common sense, is known as Benford's Law.
Who discovered Benford's Law?
The pattern was first recorded by Simon Newcomb, a Canadian-American astronomer and mathematician. In 1881, Newcomb noticed that the earlier pages of logarithm tables—the books scientists used to perform complex calculations before calculators existed—were far more worn and soiled than the later pages. Since the first pages contained numbers starting with 1, he reasoned that people looked up smaller leading digits much more frequently.
Newcomb published a short paper titled "Note on the Frequency of Use of the Different Digits in Natural Numbers" in the *American Journal of Mathematics* in 1881 (source). He proposed that the occurrence of numbers is distributed so that the fractional parts of their logarithms are equally probable. However, his brief observation was largely ignored for half a century.
In 1938, the physicist Frank Benford independently rediscovered the same pattern. Benford carried out a massive statistical study, testing the first digits of 20,229 observations across 20 different domains. He counted the leading digits in lists of street addresses, molecular weights of nearly 2,000 chemicals, and even numbers appearing in an issue of *Reader's Digest*. He published his findings in a paper called "The Law of Anomalous Numbers" in the *Proceedings of the American Philosophical Society* in 1938 (source). Because of this extensive proof, the rule became universally known as Benford's Law.
Why do most numbers start with 1?
Benford's Law states that the probability P of a number having a leading digit d (where d is an integer from 1 to 9) is given by a logarithmic formula:
P(d) = log₁₀(1 + 1/d)
If you plug the numbers into this formula, you get the exact probabilities for each starting digit (source):
1: 30.1%
2: 17.6%
3: 12.5%
4: 9.7%
5: 7.9%
6: 6.7%
7: 5.8%
8: 5.1%
9: 4.6%
This steep curve happens because of how numbers grow on a logarithmic scale. To go from 10 to 20, a value has to increase by 100%. But to go from 90 to 100, the value only has to increase by 11.1%. In sets of data that grow exponentially or span multiple orders of magnitude, numbers spend much more "time" starting with a 1 before they get large enough to start with a 2.
Mathematical patterns like Benford's Law show up everywhere, and understanding why probabilities behave this way takes more than just memorising the formula. Fermi's AI tutor works out what you already know and builds a plan for the session, holding a line of reasoning on a virtual board until you see the logic behind the numbers.
What is the checklist for testing Benford's Law?
Not every list of numbers follows this rule. If you want to run a Benford test on your own data, use this checklist to ensure the dataset is suitable:
Does the data span several orders of magnitude? It works best for numbers that range from tens to hundreds of thousands (like country populations or river lengths).
Is the data free from artificial limits? Do not use restricted ranges like human heights, where almost everyone is between 100 and 200 centimetres tall.
Are the numbers actual measurements or counts? Avoid assigned numbers like telephone numbers, bank accounts, or postcodes.
Is the data naturally skewed rather than normally distributed? It does not apply to IQ scores or exam marks, which cluster symmetrically around an average.
If your data passes this checklist, tally the leading digits from 1 to 9. You will almost certainly find a curve matching Benford's 1938 prediction. If you want to understand how standard models treat normally distributed datasets instead, reading about Probability in JEE maths: five reasoning mistakes and fixes is a good next step.
How is Benford's Law used in fraud detection?
Today, Benford's Law is a standard tool in forensic accounting and fraud detection.
When humans try to fabricate data—such as inventing fake expenses on a tax return or manipulating scientific research—they generally assume that "random" means an even spread of all digits. A fraudulent accountant might sprinkle in an equal number of expenses starting with 1, 5, and 9.
By running financial records through a simple Benford's Law test, auditors can instantly flag data that looks suspicious. If the digit 1 appears only 15% of the time, or if the digit 8 suddenly spikes to 20%, investigators know exactly where to look for the missing or fake numbers. It is a powerful example of how historical observations, like Henry Briggs and how base-10 logarithms were first computed, have created practical tools we rely on centuries later.
The next time you look at a table of random statistics, look closely at the first digit. You will see that 1 dominates the board, exactly as Simon Newcomb noticed over 140 years ago.


