

On this page
If you want to know whether the tallest students in a class are also the fastest runners, you can simply rank them by height and then by speed. In 1904, British psychologist Charles Spearman introduced a mathematical formula to measure exactly how closely two such ranked lists match.
Spearman needed a way to compare human mental abilities without assuming the data followed a perfect bell curve. His solution bypassed raw scores entirely and looked only at their order. Today, his non-parametric method remains a cornerstone of data analysis and a key part of the Class 11 Economics syllabus in India.
What is the Spearman rank correlation history?
In the late 19th century, Karl Pearson developed the product-moment correlation to measure how two variables move together. However, Pearson's method required quantitative data that was normally distributed.
Charles Spearman was a psychologist trying to measure human intelligence by comparing sensory discrimination with school performance. His data did not fit Pearson's strict statistical requirements. To solve this, he developed the rank correlation method, which was first published in his 1904 paper, "The Proof and Measurement of Association between Two Things". By converting raw data into ranks, Spearman's method could handle non-linear relationships and qualitative traits, laying the groundwork for nonparametric statistics.
What is Spearman's rank correlation coefficient?
Spearman's rank correlation coefficient is a number ranging from -1 to +1 that indicates how strongly two sets of ranks are correlated.
A value of +1 means the two lists are ranked in the exact same order, -1 means they are in perfect reverse order, and 0 means there is no relationship at all. Because it looks at ranks rather than raw measurements, it is ideal for ordinal data—situations where you can say one thing is better or worse than another, but cannot measure exactly how much better.
How is it used in Class 11 statistics?
In India, students study this method in the Class 11 Statistics for Economics syllabus. It is introduced as a way to measure the relationship between qualitative attributes that cannot be measured directly, such as honesty, beauty, or intelligence.
If you are judging a painting competition, two judges cannot assign an objective numerical score to a painting's "beauty". However, they can rank the paintings from first to last. Spearman's formula allows economists and students to calculate exactly how much the two judges agreed with each other. Understanding the logic of these statistical tools is more useful than rote memorisation; just as Ebbinghaus's forgetting curve shows that mechanical cramming fades quickly, real understanding lasts.
How do you calculate the coefficient?
To find the correlation between two sets of data without tied ranks, you use Spearman's formula: rs = 1 - (6Σd²) / (n(n² - 1)).
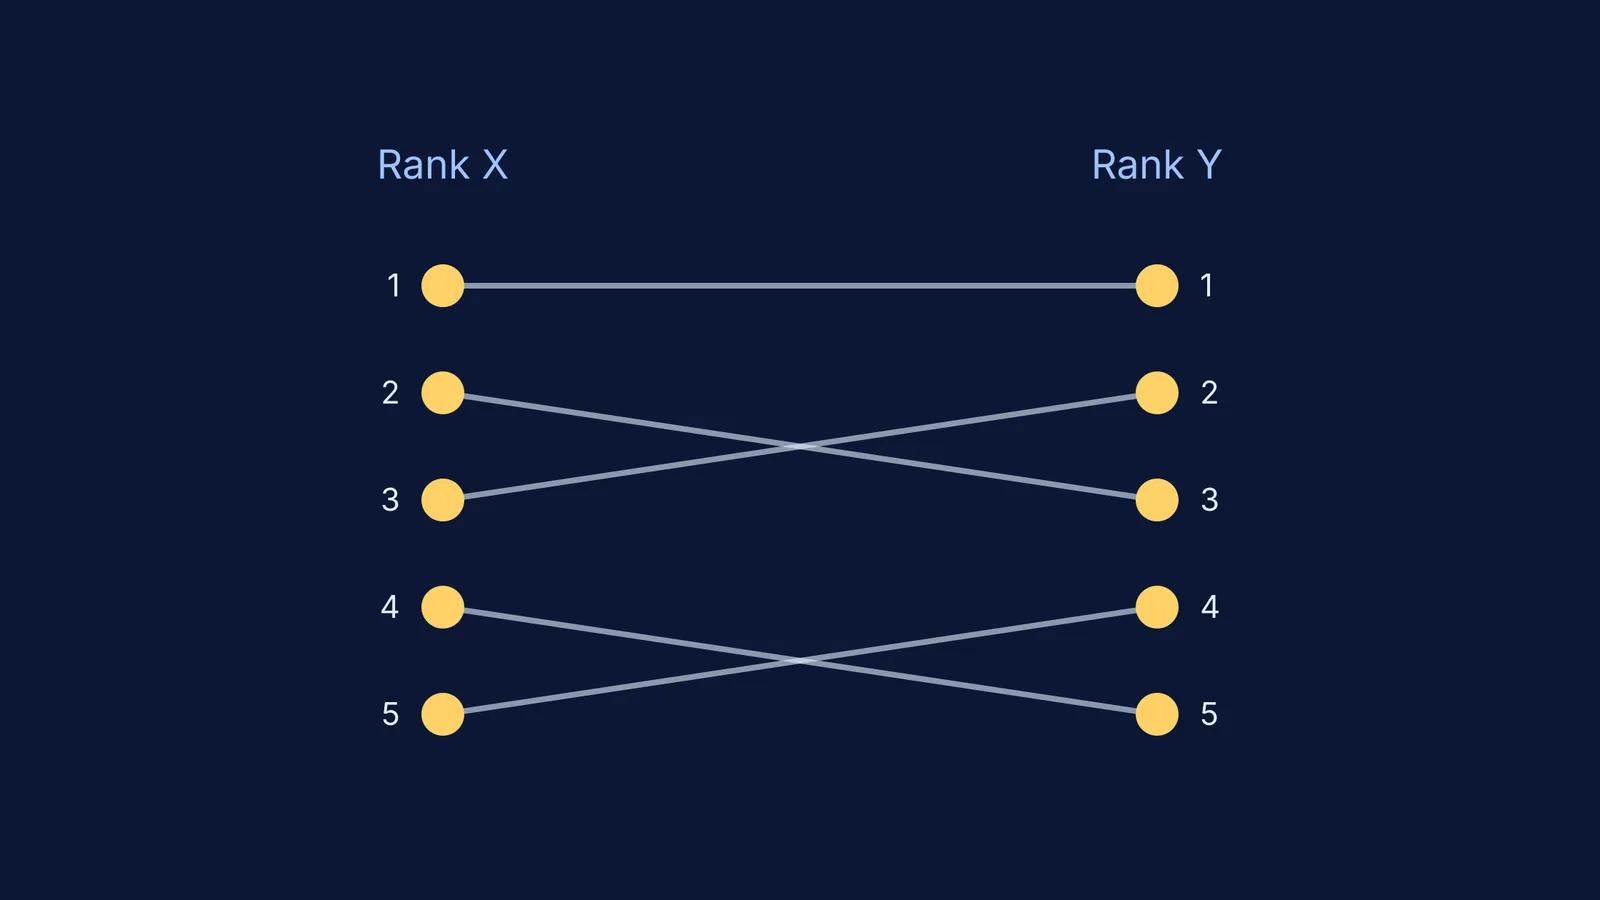
Here is a step-by-step framework to calculate it for five items (n = 5):
Assign ranks: Give the highest value Rank 1, the second highest Rank 2, and so on for both variables (Variable X and Variable Y).
Find the difference (d): Subtract Rank Y from Rank X for each item. For example, if an item is 2nd in X and 3rd in Y, the difference is -1.
Square the differences (d²): Square each d to remove negative signs (-1 × -1 = 1). Setting up a clean table for this step prevents arithmetic slips, much like how neat working can save you marks in long exams.
Sum the squares: Add all the d² values together to get Σd². If the squared differences are 0, 1, 1, 1, and 1, the sum is 4.
Apply the formula: Plug the values into rs = 1 - (6 × 4) / (5(5² - 1)). This becomes 1 - 24 / 120, which simplifies to 1 - 0.2 = 0.8.
The result is 0.8, which shows a strong positive correlation between the two sets of ranks.
If you are reviewing this topic and make a mistake in your table, finding the error can be frustrating. The Fermi Problem Library has worked problems with a step-by-step solver that explains the reasoning rather than printing an answer, making it easier to trace a slipped minus sign or an incorrect sum.
Working with ranks instead of raw numbers might seem like losing information, but it is precisely what makes Spearman's 1904 formula so durable. By simplifying the data to its bare order, you can uncover clear relationships in the messiest of real-world observations.


