On this page
Every biology student learns that urine formation begins with glomerular filtration. Fewer know that the idea had to be argued for, by a young German physiologist who also built a machine to draw blood pressure as a line on paper. His name was Carl Ludwig, and both ideas come from one habit: treat the body as a system of pressures you can measure.
Who was Carl Ludwig?
Carl Friedrich Wilhelm Ludwig was born in Witzenhausen, Germany, on 29 December 1816 and died in Leipzig on 23 April 1895, according to his Wikipedia biography. In 1865 he took the new chair of physiology at the University of Leipzig, where the institute he built is now called the Carl Ludwig Institute of Physiology.
A review by Heinz-Gerd Zimmer places Ludwig among the "organic physicists", with Helmholtz and others, who wanted to explain life by physics and chemistry alone; scholars who studied with him included Adolf Fick and Ivan Pavlov (Zimmer, Pflügers Archiv, 1996).
What did Ludwig's kymograph do?
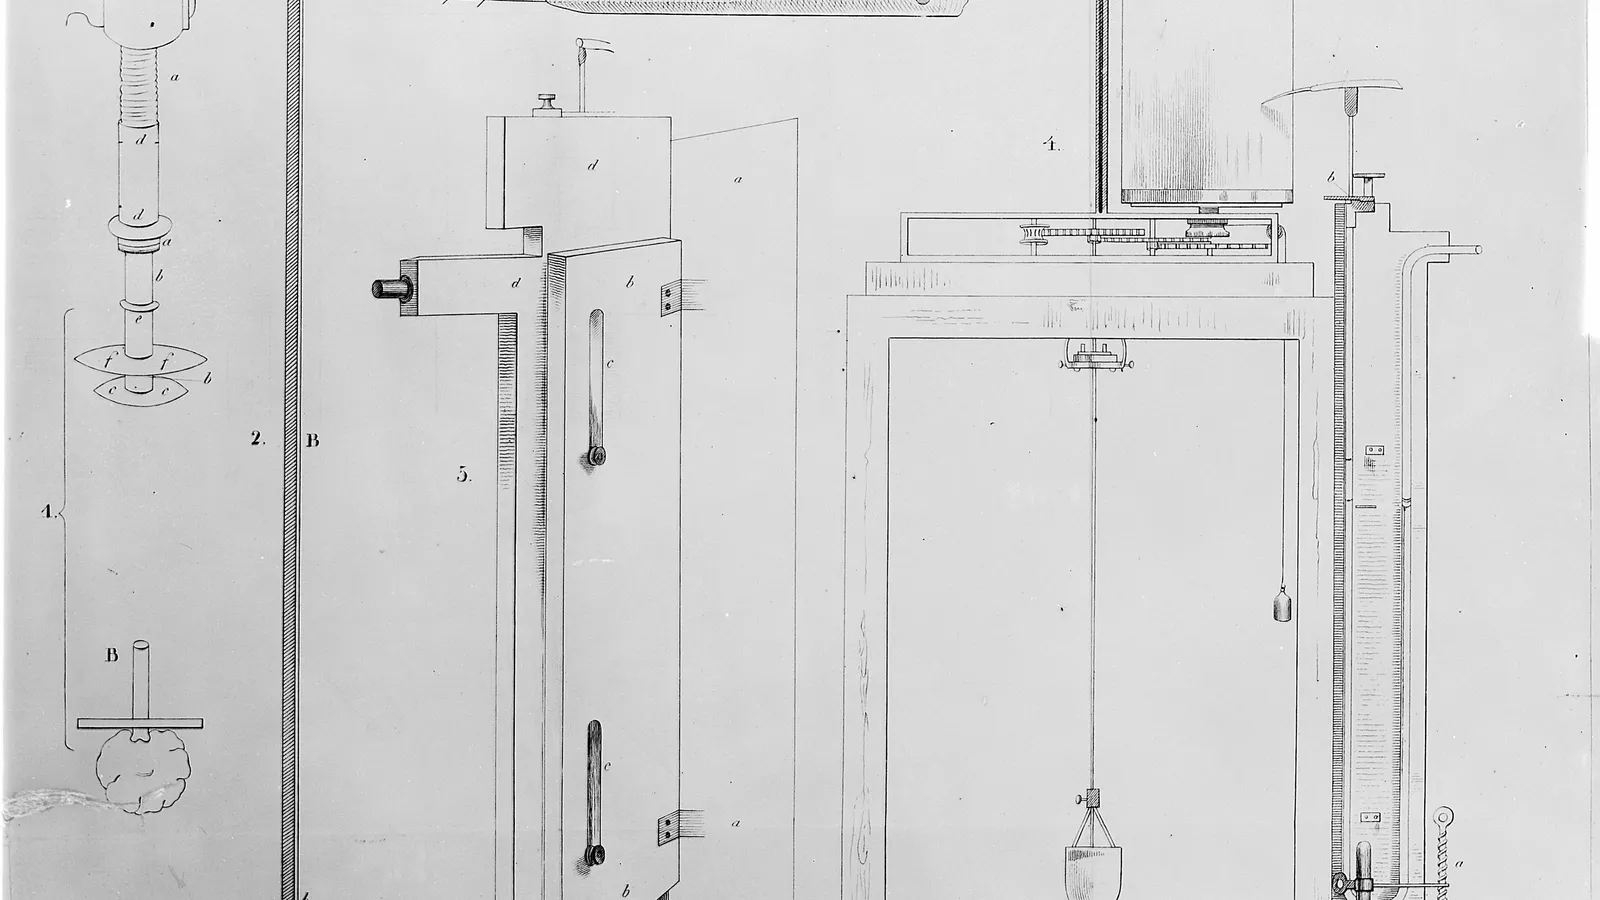
A kymograph is a revolving drum wrapped in paper, with a stylus that moves to record changes in pressure or motion (Hektoen International). Ludwig invented it in 1847 to make a written record of changes in blood pressure.
As the pressure rose and fell, the stylus rose and fell with it, and the turning drum spread those movements out in time. A 2016 review in the IEEE Journal of Biomedical and Health Informatics says the kymograph "for the first time enabled the recording of continuous blood pressure" (Ding et al., 2016).
Zimmer calls the kymograph Ludwig's most important apparatus because it made recording and documenting functional measurements possible for the first time (Zimmer, Canadian Journal of Cardiology, 1999).
The cuff your doctor uses came later; you can read how it arrived in our story of Scipione Riva-Rocci and the blood pressure cuff.
What was Ludwig's glomerular filtration theory?
In 1842, while at Marburg, Ludwig published a paper on how the glomerulus works (Hektoen International). William Bowman had proposed that only water passed through the glomerulus and that all the dissolved substances in urine were added later by tubular secretion. Ludwig disagreed. He argued that hydrostatic forces push a filtrate through the glomerulus and that the tubules then reabsorb part of it.
That is the two-step picture, filter first and then reclaim, that you study today. A 1996 paper in Nephrology Dialysis Transplantation is titled simply "Carl Ludwig: the discoverer of glomerular filtration" (Davis, Thurau and Häberle, 1996). Bowman's side of the story is in our post on William Bowman and the capsule that filters blood.
How much do your kidneys filter each day?
The NCERT Class 11 biology chapter on excretion gives the numbers (NCERT, Excretory Products and their Elimination). On average, 1100-1200 mL of blood passes through the kidneys each minute, roughly one-fifth of what each ventricle pumps out in a minute. Glomerular filtration rate (GFR) is the volume of filtrate the kidneys form per minute. In a healthy person, GFR is about 125 mL per minute. Only about 1.5 litres of urine leave the body each day.
Here is a worked example you can do in your head, using those NCERT figures:
Convert GFR to a day: 125 mL per minute x 60 minutes x 24 hours = 180,000 mL, or 180 litres.
Compare with urine: 1.5 litres out of 180 litres is 1.5 / 180, about 0.8%.
So about 99% of the filtrate is reabsorbed. NCERT states this as "nearly 99 per cent".
Ludwig did not have these figures in 1842, but they fit his picture. The kidneys form a large volume of filtrate and pass only a small volume of urine, so the tubules must take most of the filtrate back: filter first, then reclaim. For the next steps, see our guide to urine formation: filtration, reabsorption and secretion.
How should you revise Ludwig for exams?
Use this checklist when you revise the excretion chapter:
Ludwig, 1842: pressure-driven filtration at the glomerulus, then tubular reabsorption.
Kymograph, 1847: continuous blood pressure on a moving drum.
The contrast with Bowman, in one sentence.
125 mL per minute to 180 litres per day, without a calculator.
How the 99% reabsorption figure fits the filter-then-reclaim picture, in one line.
If the pressures in the glomerulus are hard to picture, the Fermi Concept Library gives each biology concept its own lesson and its place in the map, so you can see where filtration sits beside reabsorption and secretion. For practice with numericals, the Fermi Problem Library has worked problems with a step-by-step solver that explains the reasoning rather than printing an answer.
Next time you see a blood pressure graph or a GFR value, remember that both trace back to work Ludwig did in the 1840s.