On this page
Between 1875 and 1894, the Prussian army kept count of the soldiers in each of its army corps who were killed by a kick from a horse, according to the notes by Antony Unwin and Bill Venables that accompany their horse-kick dataset. In 1898 the statistician Ladislaus Bortkiewicz used those records in his book Das Gesetz der kleinen Zahlen, "The law of small numbers". He showed that deaths that look like pure bad luck still follow a pattern you can predict: the Poisson distribution. You can check his result with a calculator.
Who was Ladislaus Bortkiewicz?
Bortkiewicz was born in Saint Petersburg on 7 August 1868 and died in Berlin on 15 July 1931. He was a Russian economist and statistician of Polish ancestry who taught at the University of Berlin from 1901, as his Wikipedia biography records. Economists also know him for his work on Karl Marx's Capital and as a doctoral supervisor of Wassily Leontief.
What did Bortkiewicz find about horse-kick deaths?
He took yearly counts of horse-kick deaths in 14 army corps over 20 years (Unwin and Venables). The version printed in most textbooks uses 10 of those corps. The other 4, organised differently, are left out; the vcd documentation notes that R. A. Fisher did not consider them in 1925. That leaves 10 corps over 20 years, or 200 corps-years.
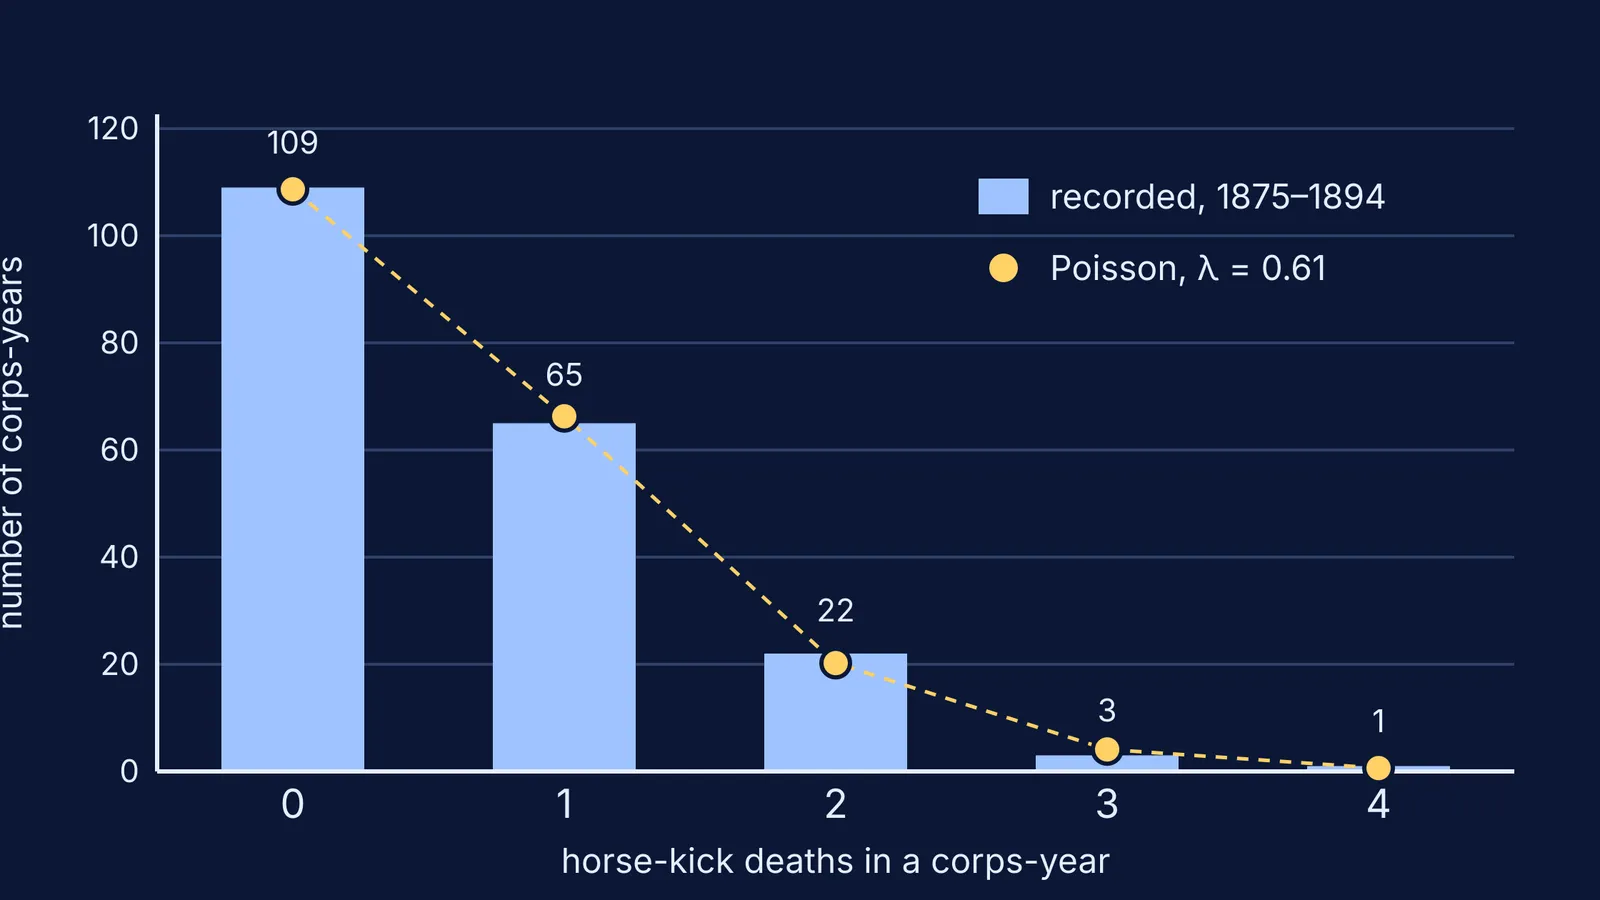
Here is how those 200 corps-years break down, from the data table at Reed College:
109 corps-years with no deaths
65 with one death
22 with two deaths
3 with three deaths
1 with four deaths
That adds up to 122 deaths in 200 corps-years, so a corps lost on average 0.61 soldiers a year to horse kicks (Reed College). Any one death was unpredictable. The overall pattern turned out not to be.
What is the Poisson distribution?
The Poisson distribution models the number of events that happen in a fixed interval, with probability P(k) = e^(−λ) λ^k / k! for k = 0, 1, 2, and so on (NIST Engineering Statistics Handbook). Its mean and its variance are both equal to λ (NIST). The mathematics came from Siméon Denis Poisson and his distribution for rare events. What Bortkiewicz added was evidence that real-world counts behave this way.
Poisson tends to fit when an event has many chances to happen, each chance is unlikely, and one event does not cause the next. Fatal kicks in a corps fit that description.
How do you check the fit yourself?
You need only one number, the average λ = 122 / 200 = 0.61 (Reed College). Multiply each probability by 200 to get the number of corps-years you would expect:
P(0) = e^(−0.61) ≈ 0.543, so you would expect about 108.7 corps-years with no deaths. The records show 109.
P(1) = P(0) × 0.61 ≈ 0.331, which gives about 66.3. The records show 65.
P(2) = P(1) × 0.61 / 2 ≈ 0.101, which gives about 20.2. The records show 22.
P(3) = P(2) × 0.61 / 3 ≈ 0.021, which gives about 4.1. The records show 3.
P(4) = P(3) × 0.61 / 4 ≈ 0.003, which gives about 0.6. The records show 1.
The shortcut in steps 2 to 5 follows from the formula: each probability is the previous one times λ / k.
If a step like the λ / k shortcut feels like a trick rather than a reason, the Fermi Problem Library has worked problems with a step-by-step solver that explains the reasoning rather than printing an answer. For the underlying idea, read our explainer on probability distributions of a random variable.
What does the horse-kick data still teach?
In 2025, Antony Unwin and Bill Venables took a fresh look at the dataset in Significance, the magazine of the Royal Statistical Society. They argue that it teaches not only the Poisson distribution but also the importance of background information when you build a statistical model (Significance, 2025). Their published data extend the series and add deaths from falling off a horse and from drowning (Horsekicks package).
The lesson: a neat fit starts your thinking rather than ending it. Before you use Poisson for any count, check:
Is the event rare in each unit of time or space?
Are the events independent, so one does not trigger the next?
Are the units comparable? That is why the four differently organised corps were dropped.
Is the average close to the variance?
Do the expected counts match the observed ones across the whole table, not just at zero?
If the probability formulas are rusty, the Fermi Concept Library gives every concept in mathematics its own lesson. Then read the other half of the story: Jacob Bernoulli and the law of large numbers.