On this page
In 1888 Harvard College Observatory assigned Antonia Maury a detailed study of the spectra of the bright stars north of declination −30°. Her 1897 catalogue sorted stars not only by which dark lines appeared in their light, but by what those lines looked like: broad and hazy, or narrow and sharp. That second detail became a way to tell a giant star from a dwarf.
What did Antonia Maury discover about star spectra?
Maury's *Spectra of Bright Stars* appeared as Volume 28, Part I of the Annals of the Harvard College Observatory, and Edward Pickering's preface says she was “alone responsible for the classification”.
She examined about 4,800 photographs of the spectra of 681 of the brightest stars north of declination −30°, according to the catalogue's first chapter.
She arranged the spectra in a sequence of 22 groups. But stars with the same lines in the same places could still look different, so she used three parallel series she called “divisions”:
Division a: 355 of the 681 stars. No single lines are relatively wide except those of hydrogen and calcium, and all are clear. Her examples include Vega, Procyon, Arcturus and the Sun.
Division b: all the lines are relatively wide and hazy, as in Altair.
Division c: the hydrogen lines are narrow and well defined, and at most eight tenths as intense as in divisions a and b.
In-between spectra got two letters, such as ab or ac. Maury wrote that stars of division c “must differ more decidedly in constitution from those of Division a than is the case with those of Division b” (Annals, p. 5). She had spotted a real physical difference without yet knowing what it was.
How did Hertzsprung use Maury's c stars?
In 1905 Ejnar Hertzsprung published “Radiation from stars” in a German photographic journal and mentioned Maury and Cannon in its very first sentence, as the Linda Hall Library notes. He argued that Maury was right: there were two kinds of red stars, some small and close, others gigantic, luminous and very far away.
The idea of dwarf and giant stars, though not those names, was first established by Hertzsprung in 1905, and his first diagrams supporting it appeared in 1911, writes the astronomer and historian Owen Gingerich. Those diagrams grew into the chart told in our story of Hertzsprung, Russell and the diagram that sorts the stars.
In a 1908 letter to Pickering, quoted by Time, Hertzsprung wrote that neglecting the properties she had stressed was “nearly the same thing as if the zoologist, who has detected the deciding differences between a whale and a fish, would continue classifying them together.” The temperature side of the story is in Annie Jump Cannon and the OBAFGKM order of star types.
Why do giant stars have sharper spectral lines?
A giant star has a large, extended photosphere, so its atoms are spread over a great volume and the density is low, explains OpenStax Astronomy 2e. Line width depends on collisions between particles: more collisions mean broader lines, and collisions are more frequent in denser gas.
So a star with a lower-pressure photosphere shows narrower spectral lines than a star of the same temperature with a higher-pressure one. That is why Maury's sharp-lined c stars turned out to be large, luminous, low-density stars. The 1978 *Revised MK Spectral Atlas for Stars Earlier Than the Sun*, which W. W. Morgan co-wrote, was dedicated to her as “Master Morphologist of Stellar Spectra”, Time reports.
Worked example: read two stars the way Maury did
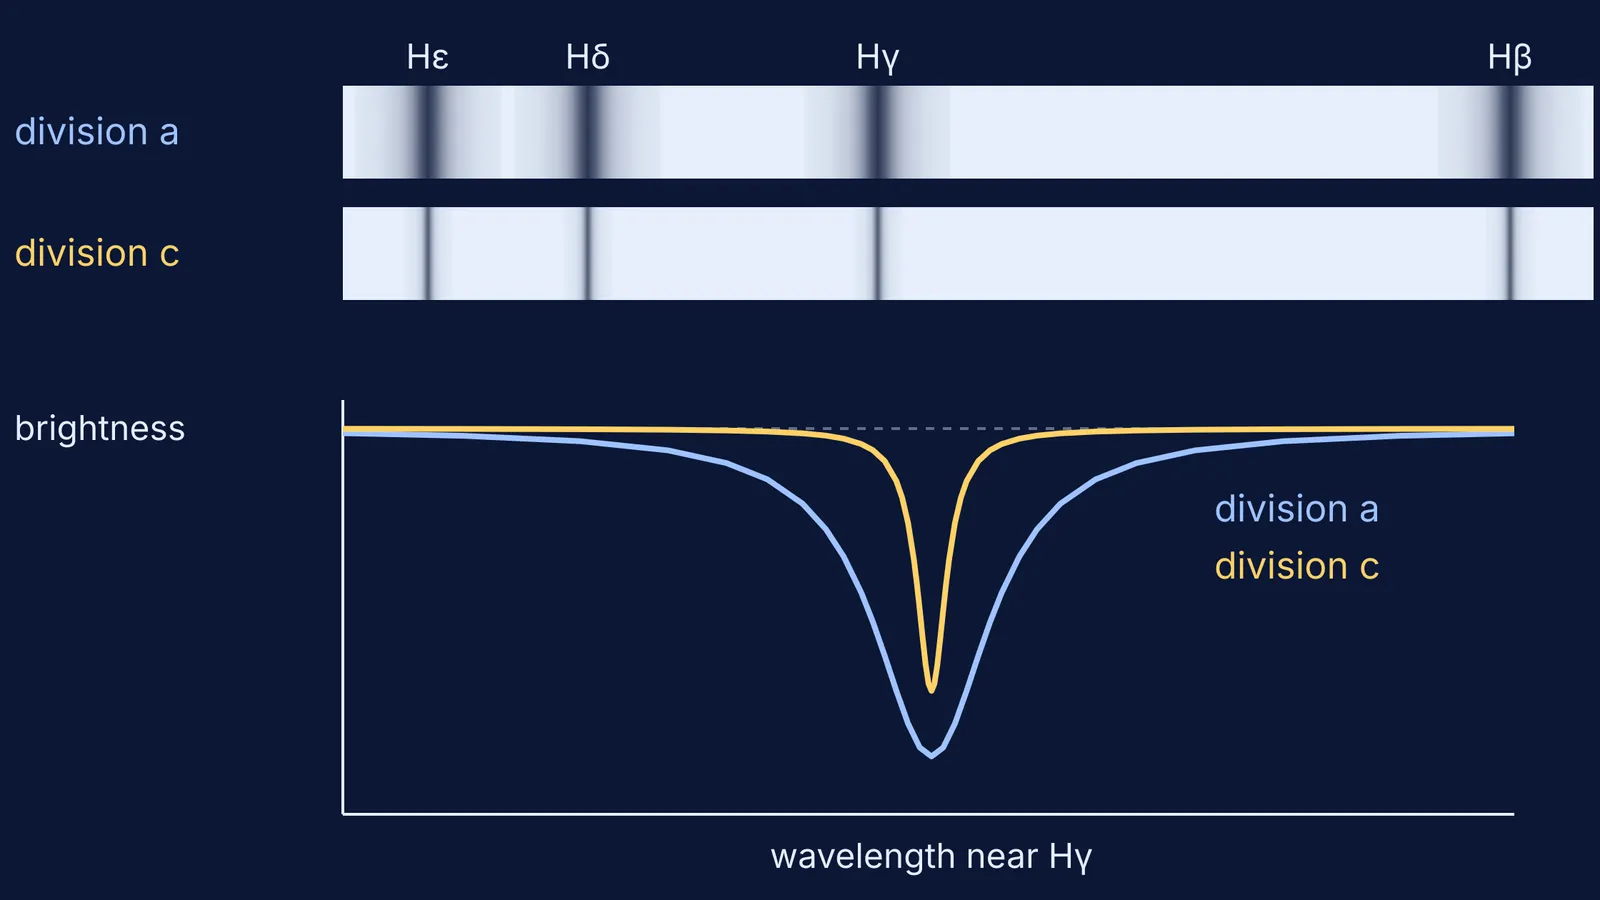
The diagram at the top of this page shows the hydrogen lines her plates covered, Hε to Hβ, from the Balmer series you meet when studying the hydrogen spectrum. Read it in four steps:
Check the positions. Both strips have lines at the same wavelengths, so on position alone the stars look alike.
Look at the width. The top star's lines spread into broad wings; the bottom star's are thin and crisp.
Compare the depth. In the graph, the sharp line is shallower too, matching Maury's “eight tenths” description of division c.
Reason about pressure. Narrow lines mean fewer collisions, so lower density, so a larger star. The bottom one is the giant.
If collision broadening still feels abstract, watching it helps. The Fermi Simulation Lab has interactive simulations for ideas that are easier to see than to read, and the Fermi Concept Library gives each physics concept its own lesson.
For another discovery hidden in Harvard's photographs, read about Williamina Fleming and the first white dwarf.