

On this page
Reading kinematics graphs is a notoriously tricky skill. In a classic study of 895 high school and college students published in the *American Journal of Physics*, researchers found that students frequently misread graphs as literal pictures of motion, mistaking a line's height for its slope or confusing a curved graph for a physical hill (Beichner, 1994). When you look at an exam problem featuring multiple moving objects, it is easy to get overwhelmed. If you struggle to decipher what colliding lines and slopes actually represent, you are falling into a well-documented cognitive trap.
What happens when two position-time graphs intersect?
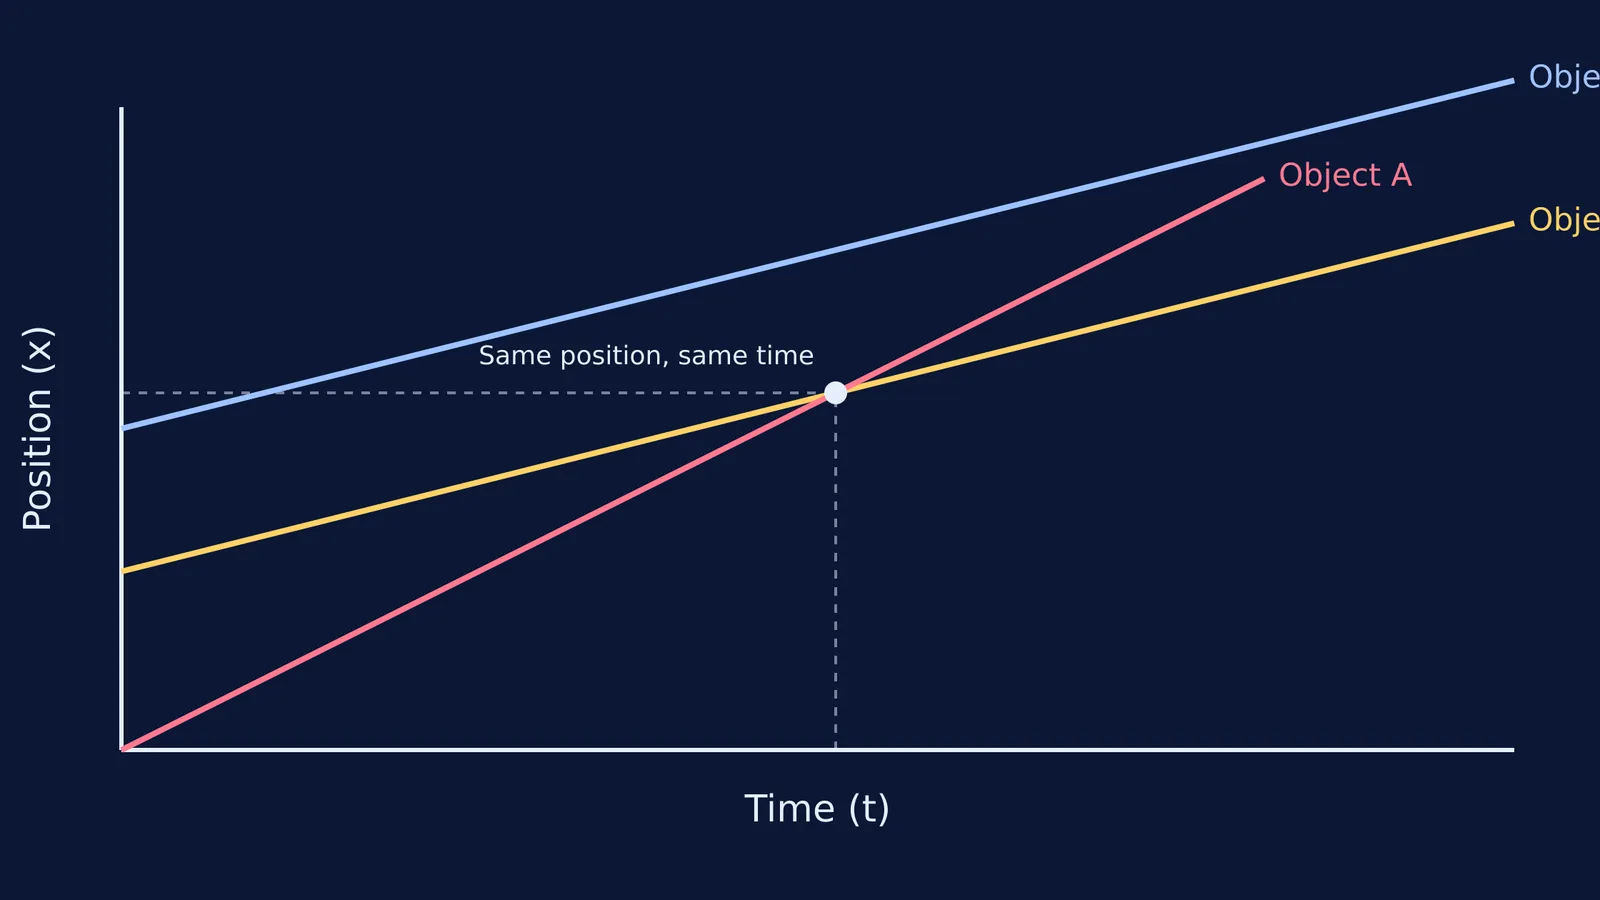
On a position-time (x-t) graph, the vertical axis tells you where an object is located, and the horizontal axis tells you when it is there. Therefore, the intersection of two position-time graphs means the two objects are at the exact same position at the exact same time.
In the real world, this singular point represents a meeting, a collision, or one object overtaking another. For instance, if you are analysing a race, the moment the faster runner's graph crosses the slower runner's graph is the exact instant they pass each other on the track. You can read this location directly from the graph's vertical axis, a fundamental principle of graphical analysis taught in foundational texts like *College Physics* (OpenStax).
It is crucial not to confuse this crossing point with the objects' speeds. Just because two lines intersect does not mean the objects are travelling at the same velocity. In fact, if the lines cross, they must have different slopes, which guarantees their velocities are different. The object with the steeper slope is simply moving faster and is in the process of passing the slower one. Understanding this distinction is key to solving complex kinematics problems where multiple objects interact, such as a police car chasing a speeding motorist or two trains passing on parallel tracks.
What does it mean if the lines are parallel?
The slope of a position-time graph represents the object's velocity, calculated as the change in position divided by the change in time (Δx / Δt). If two objects have parallel lines on the graph, their slopes are identical. This mathematically means they are moving at the exact same constant velocity.
Because parallel lines never intersect, these two objects will never meet. Think of two cars driving down a straight highway, both cruising at the exact same speed, but one started ahead of the other. Because their speeds match perfectly, the distance between them never changes. Their position-time graphs will remain parallel indefinitely, separated by a vertical gap that represents that initial head start. No matter how far you extend the time axis on your graph, the vertical distance between the two lines will remain absolutely constant, reinforcing the fact that relative velocity is zero.
Visualising these relative motions can sometimes be difficult. If you have concept gaps about how an object's speed or starting position alters its graph, the Fermi Concept Library has every concept in physics, chemistry, biology, mathematics and computing, each with its own lesson and its place in the map.
How do you read a position-time graph?
Before you start plugging numbers into kinematic formulas—something we cover extensively in our guide to Equations of motion: choosing the right one and getting signs right—run through this quick decision checklist to ensure you are interpreting the x-t graph correctly:
Check the axes first: Make absolutely sure it is a position-time graph, not a velocity-time graph. An intersection on a velocity-time graph means the objects share the same speed, not the same physical location.
Read the slope for velocity: A steeper line means a higher speed. A downward slope (a line angling towards the bottom right) means the object is moving backward, representing a negative velocity.
Look for the crossing point: The horizontal coordinate of the intersection gives you the exact meeting time. The vertical coordinate gives you the exact meeting place. Trace lines from the intersection point straight down to the time axis and straight across to the position axis to read these values accurately.
Identify parallel lines: If the slopes match, the velocities match, and the objects will maintain their initial separation distance forever.
By deliberately separating the idea of *where* an object is (the vertical height of the line) from *how fast* it is moving (the steepness of the line), you can tackle Reading physics graphs: slopes, areas and common misreadings without second-guessing yourself in the exam hall.


