On this page
Measuring g with a pendulum looks like a ten-minute job: time a swing, put it in a formula, done. Then the answer comes out at 9.4 or 10.2 m/s² and you cannot tell why. The fix is to take readings at several lengths and use the slope of a graph, which hides some errors and exposes others. This post walks through the method with a full set of sample readings.
Which syllabuses include this experiment?
The CBSE Physics curriculum for 2026-27 lists, in Section A of the Class 11 practicals: "Using a simple pendulum, plot its graph and use it to find the effective length of second's pendulum." The physics syllabus in the JEE (Advanced) 2026 Information Brochure includes "Determination of g using simple pendulum" among the experiments for error analysis. The JEE (Main) 2026 syllabus lists a different pendulum item, energy dissipation, under Experimental Skills. Check the documents for your own year.
What is the principle?
Experiment 6 of the NCERT Class 11 physics lab manual gives T = 2π√(L/g) for small amplitudes, rewritten as:
T² = (4π²/g) × L
L is the effective length, from the point of suspension to the centre of the bob: string length plus hook length plus bob radius. A graph of T² against L is a straight line through the origin with slope 4π²/g, so g = 4π²/slope.
The manual's procedure, in short:
Displace the bob by no more than 15 degrees and release it gently, so it swings in one plane without spinning.
Start timing as the bob crosses the mean position, and count oscillations each time it crosses in the same direction.
Time enough oscillations (say 20 or 25) that the run lasts 50 s or more, and repeat.
Change the length by about 10 cm each time and take five or six lengths.
A worked set of readings
These are sample numbers, times for 20 oscillations read to 0.1 s:
L = 0.60 m: t = 31.2 s, T = 1.560 s, T² = 2.434 s²
L = 0.70 m: t = 33.5 s, T = 1.675 s, T² = 2.806 s²
L = 0.80 m: t = 35.9 s, T = 1.795 s, T² = 3.222 s²
L = 0.90 m: t = 38.2 s, T = 1.910 s, T² = 3.648 s²
L = 1.00 m: t = 40.1 s, T = 2.005 s, T² = 4.020 s²
L = 1.10 m: t = 42.1 s, T = 2.105 s, T² = 4.431 s²
Single readings give g = 4π²L/T² values between 9.73 and 9.85 m/s². The scatter is the timing noise.
The best straight line through the six points has a slope of 4.02 s²/m, so g = 4π²/slope = 39.48/4.02 = 9.82 m/s². The line meets T² = 4 s² (a 2 s period) at L = 0.993 m, so the effective length of the seconds pendulum from this graph is about 99.3 cm. NCERT's oscillations chapter works the same case with g = 9.8 m/s² and gets about 1 m.
Why is the graph better than one reading?
Suppose you forgot the bob radius and hook, and every L you used was 2.0 cm too short. Each point shifts left by the same amount. The line moves, but its slope does not change, so g from the slope is still 9.82 m/s². A single reading with L = 0.58 m instead of 0.60 m would give 9.41 m/s², more than 4 percent low.
A constant error in L appears as an intercept, not as a change in slope. If your line clearly misses the origin, look for exactly this kind of offset.
How much do amplitude and timing matter?
T = 2π√(L/g) relies on sin θ ≈ θ. Working the exact pendulum equation gives periods about 0.19 percent longer at 10°, 0.43 percent at 15° and 0.77 percent at 20°. Since g depends on 1/T², a 15° swing makes g come out nearly 1 percent low. In a study of an introductory university physics lab, Holmes, Wieman and Bonn (2015) had students measure a pendulum's period at different amplitudes. Precise enough measurements exposed this small-angle approximation, even though most students expected the period to be independent of angle. In their study, students repeatedly asked to compare datasets and act on the comparison were 12 times more likely than a control group to propose or make improvements to their methods later on.
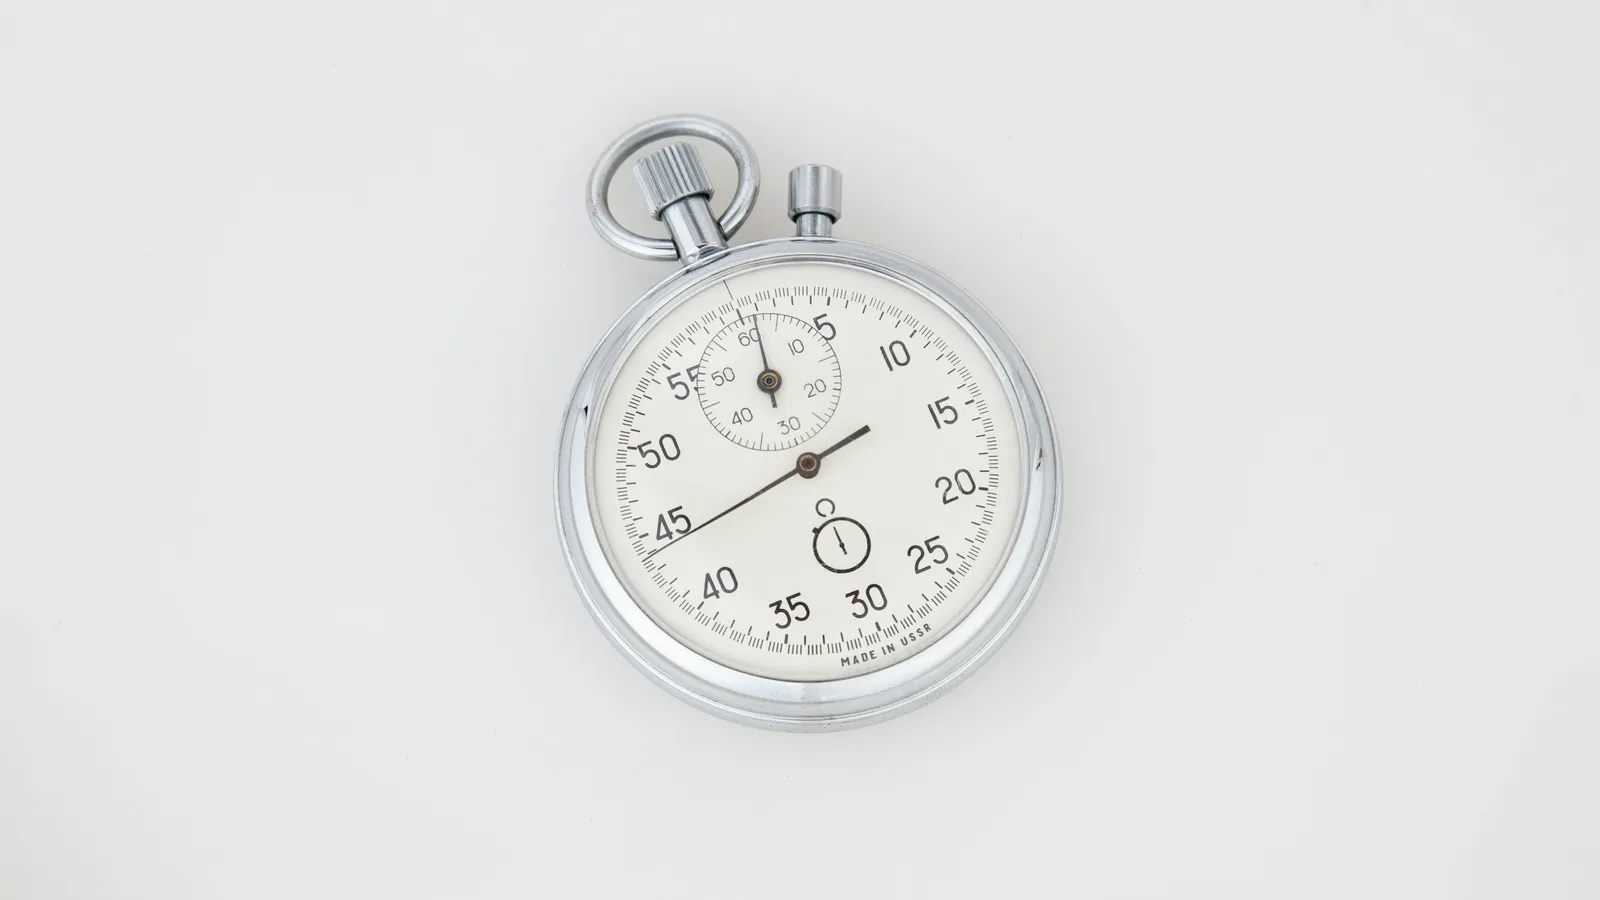
Timing matters even more. If you start or stop the watch 0.2 s late (a sample figure) on a 31.2 s run, T is off by 0.64 percent and g by about 1.3 percent. That is why the manual asks for long runs. Nelson and Olsson (1986) discuss the further corrections needed for precise work and describe a simple lab experiment that found g to four significant figures.
Common mistakes and how to avoid them
Plotting T instead of T². The L–T graph is a curve. Only T² against L is a straight line.
Counting the start as oscillation 1. Count "zero" as you start the watch.
Large swings. Keep the amplitude small, and the same for every length.
Slope from two data points. Draw the best line first, then use two widely spaced points on the line.
Light, bulky bob. Air drag and buoyancy lengthen the period. The manual recommends a small, dense metal bob.
For the general method, see our guides on reading physics graphs and on error propagation in measurements.
A practice routine before the practical
Recalculate g from the sample readings above, by hand, and plot them on graph paper.
Shift every L by 2 cm and confirm that the slope stays the same.
Write a one-line answer to "why T² and not T?" and "why 20 oscillations, not 1?"
In the lab, compare your periods at 5° and 15° at one length before your main run.
If you want to see how period depends on length and amplitude before you go to the lab, the Fermi Simulation Lab has interactive simulations for ideas easier to see than read.
Next step: plot the six sample points tonight and find the slope yourself before you look at the answer above.