

On this page
What do the nodes and branches of a cladogram actually mean?
Most evolutionary diagrams in biology textbooks are cladograms or phylogenetic trees. While both map evolutionary lineage, a cladogram focuses strictly on branching order and nested clades, whereas a phylogram or chronogram scales branch lengths to show evolutionary change or absolute time, as detailed by T. Ryan Gregory in Evolution: Education and Outreach.
To read either diagram accurately, you need to understand its structural anatomy:
Root: The single branch at the base representing the ancestral lineage shared by all organisms on the tree.
Branches: The connecting lines that depict independent evolutionary lineages persisting over generations.
Nodes: The internal branching points where a single lineage splits into two descendant paths.
Tips: The terminal ends of the branches representing the present-day species or distinct taxonomic groups being compared.
Each node represents the most recent common ancestor shared by its descendant branches. Organisms at the tips do not evolve from one another; rather, each descends from the ancestral lineage at their shared node. In school curricula and competitive exams, mastering this structure is fundamental for topics like biological classification for NEET and tracing plant lineages in plant kingdom for NEET.
Why does branch order across the tips mislead students?
The most frequent error in tree thinking is reading across the branch tips. When taxa line up along a page, readers often assume that adjacent tips are closest relatives or represent a ladder from primitive to advanced organisms.
This optical assumption leads to significant exam errors. In a study published in *The American Biology Teacher*69%5B71:CSMAET%5D2.0.CO;2), researchers Eli Meir, Judy Perry, Jon C. Herron, and Joel Kingsolver tested 410 undergraduate biology students across introductory and upper-level courses. They found that between 25% and 50% of students made persistent errors by evaluating relatedness through tip proximity or by counting intervening nodes, with approximately 40% believing that a lineage drawn as an unbranched straight line had undergone no evolutionary change.
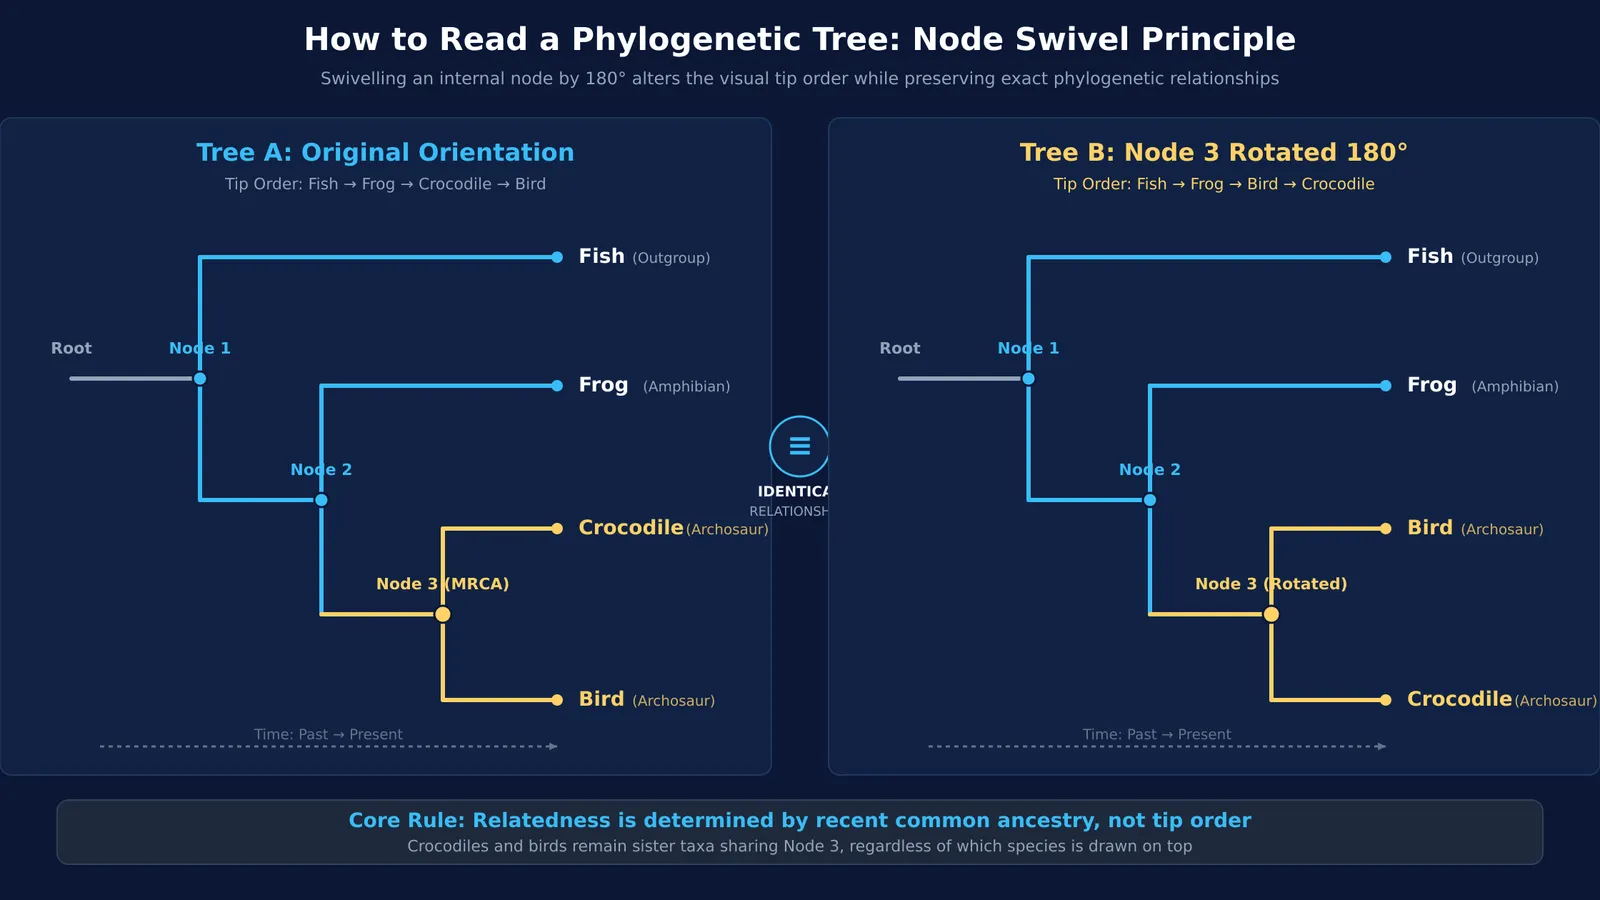
As David Baum, Stacey DeWitt Smith, and Samuel Donovan explained in *Science*, every internal node in a phylogenetic tree functions as a swivel that can rotate 180 degrees. Swivelling a node swaps the visual order of the descendant tips without altering a single evolutionary relationship. A tree depicting (Fish, (Frog, (Crocodile, Bird))) shows the exact same relationships if you rotate the archosaur node to produce (Fish, (Frog, (Bird, Crocodile))). Counting nodes between two species is equally flawed because node counts simply reflect how many extra taxa the illustrator chose to include.
How do you determine relatedness using common ancestors?
Evolutionary relatedness is determined solely by the recency of common ancestry, not by physical resemblance or tip proximity.
Two species are more closely related to each other than to a third species if they share a more recent common ancestor with each other than either does with the third.
To find which species are closest relatives on any tree, use this three-step ancestor-tracing rule:
Locate the taxa you are comparing at the branch tips.
Trace each lineage backward toward the root until their paths merge at a single junction, which marks their Most Recent Common Ancestor (MRCA).
Compare the positions of the shared MRCAs: the pair whose common ancestor lies closer to the tips (more recent in time) is more closely related.
Consider the diagnostic question highlighted by Baum et al.: Is a frog more closely related to a bony fish or to a human? Because frogs and fish share aquatic traits, students frequently choose fish. Tracing their lineages on a vertebrate cladogram reveals the truth: the frog and human lineages meet at the common tetrapod ancestor. Tracing the frog and fish backward leads past this tetrapod junction to an older ancestor uniting bony fish and tetrapods. Because frogs and humans share a more recent common ancestor, frogs are more closely related to humans.
How can you practice phylogenetic tree reading without falling into traps?
When tackling questions in NEET evolution concepts, applying systematic habits ensures you never get misled by rotated diagrams:
Identify the root and trace the direction of time: Time always flows outward from the root toward the branch tips, never across the tips.
Test by swivelling: Whenever an exam question asks whether two trees depict identical relationships, mentally rotate the internal nodes to see if the nested sister groups match.
Highlight monophyletic clades: A valid clade consists of an ancestor and all of its descendants, which can be snipped off with a single cut across a branch.
When you want to build deep fluency with evolutionary hierarchies and classification systems, the Fermi Concept Library covers every concept in physics, chemistry, biology, mathematics and computing, each with its own lesson and its place in the map. To strengthen your exam technique on multi-branch cladograms, the Fermi Problem Library has worked problems with a step-by-step solver that explains the reasoning rather than printing an answer.


