

On this page
Many Class 12 and JEE probability questions come in stages: pick a bag, then draw a ball. A tree lays the stages out left to right, so every number has its own place and a wrong one stands out.
What is a probability tree diagram?
A probability tree diagram is a picture of a multi-stage experiment: each fork is one stage, each branch is one possible outcome of that stage, and each branch carries the probability of that outcome given everything to its left.
The maths behind it is in Chapter 13 of the NCERT Class 12 Mathematics textbook. Section 13.3 states the multiplication rule of probability, P(E ∩ F) = P(E) P(F|E), and extends it to three or more events. Section 13.5.2 gives the theorem of total probability, which says you add the products over every way the event can happen.
On a tree, the multiplication rule becomes: multiply along a path. Total probability becomes: add the paths that end in the outcome you want.
How do you draw a tree for a multi-stage experiment?
List the stages in order. Each stage gets one column of forks.
At each fork, draw one branch per possible outcome, covering everything with no overlaps.
Write a probability on each branch. After the first stage, each one is conditional on the path so far.
At the end of each path, write the product of its branches.
Circle the paths that match the question and add their end values.
Take NCERT's Example 8: an urn holds 10 black and 5 white balls, and two balls are drawn one after the other without replacement (NCERT, Section 13.3). The first fork has Black 10/15 and White 5/15. After a black ball, 9 black and 5 white remain, so that fork reads Black 9/14 and White 5/14. After a white ball, it reads Black 10/14 and White 4/14.
The four paths end in 90/210 (both black), 50/210 (black then white), 50/210 (white then black) and 20/210 (both white). Both black is 90/210 = 3/7, which matches the textbook's answer. One of each colour needs two paths: 100/210 = 10/21. Writing 2 × (10/15 × 5/15) instead would treat the first ball as if it went back.
How do you read conditional probabilities off the branches?
Every branch after the first stage is a conditional probability, so you read it off the tree instead of computing it.
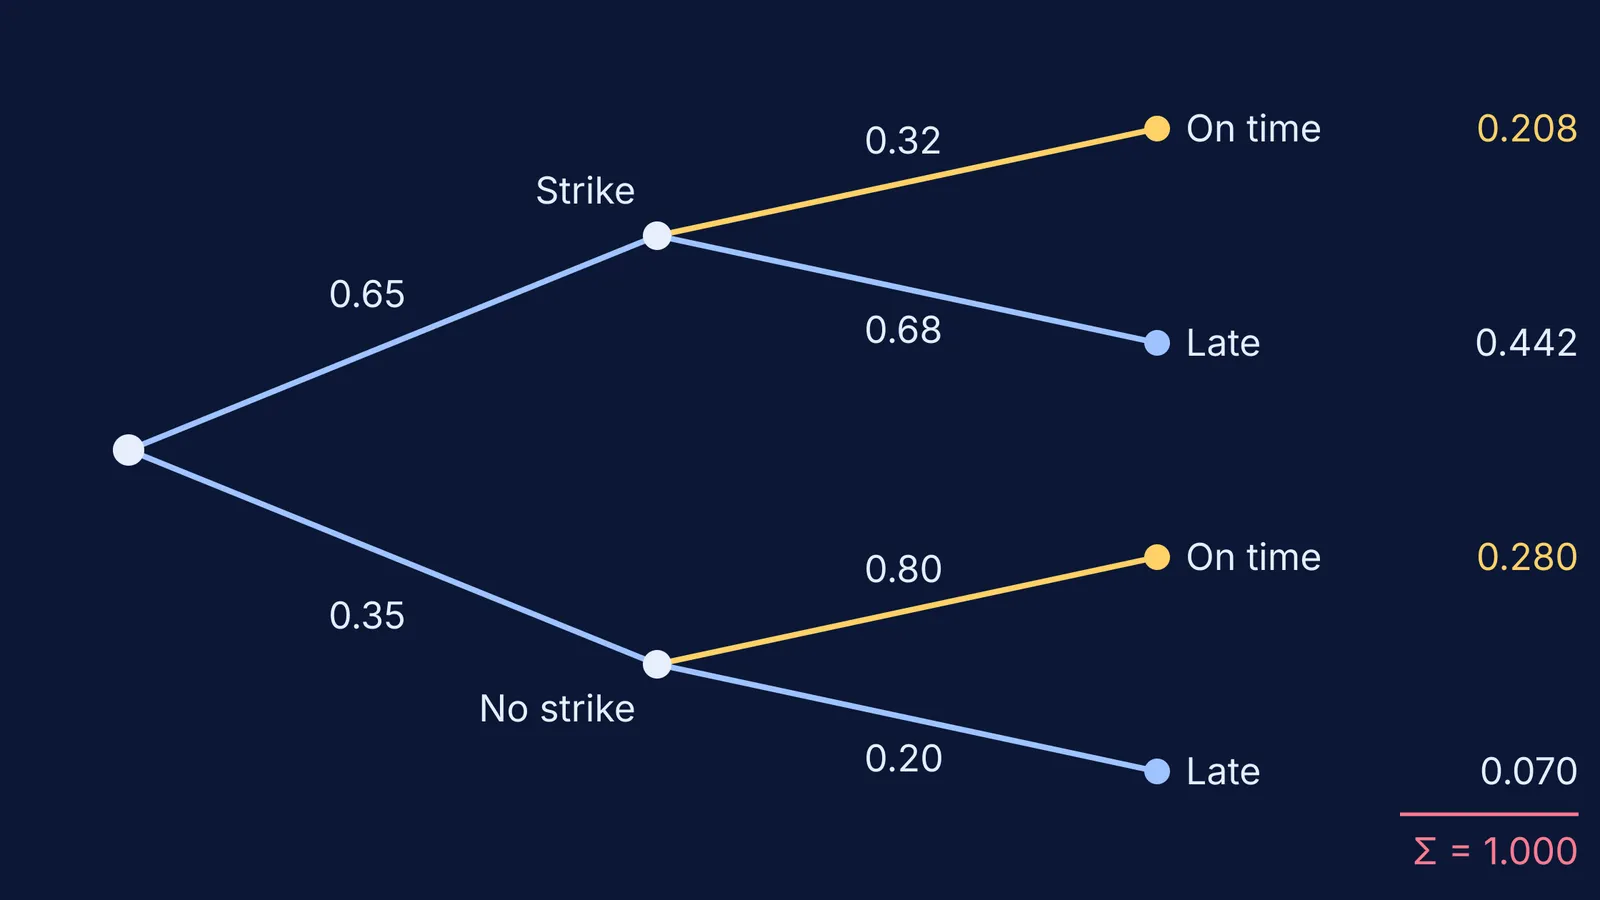
NCERT's Example 15 (Section 13.5.2) gives a 0.65 probability of a strike. A construction job finishes on time with probability 0.32 if there is a strike and 0.80 if there is not. The path Strike then On time ends in 0.65 × 0.32 = 0.208. The path No strike then On time ends in 0.35 × 0.80 = 0.28. Adding them gives P(on time) = 0.488, which matches the textbook.
The tree also answers the reverse question: if the job finished on time, how likely is it that there was a strike? Take the strike path's share of the on-time total, 0.208 / 0.488, or about 0.43. That is Bayes' theorem done with two numbers you already wrote down. For more practice, see our guide to the theorem of total probability with bag problems and our walkthrough of a ball moved from one bag to another.
How do you check that the branches sum to one?
Before you write the final answer, check:
Every fork adds to 1. In the strike tree, 0.65 + 0.35, 0.32 + 0.68 and 0.80 + 0.20 all equal 1. If one does not, you missed an outcome or used a number from the wrong stage.
All path ends add to 1. 0.208 + 0.442 + 0.28 + 0.07 = 1, which catches multiplication slips.
Second-stage numbers change when they should. Without replacement, the denominators drop by one.
Why do tree diagrams help with hard probability questions?
In a 2015 study in Frontiers in Psychology, Karin Binder, Stefan Krauss and Georg Bruckmaier gave two Bayesian reasoning problems to 259 German school students aged 16 to 18. When the problems came with a tree diagram or a 2 × 2 table filled in with natural frequencies (counts such as 65 out of 100), about 51% of answers were correct on average. With the same diagrams filled in with probabilities, about 6% were.
So when a question confuses you, redraw the tree with counts. Out of 1,000 jobs, 650 have a strike and 208 of those finish on time. Of the 350 with no strike, 280 finish on time. So 208 of the 488 on-time jobs had a strike. The same idea is behind our explainer on why a positive on a 99% accurate test may be a false alarm.
If your tree still gives the wrong answer and you cannot see why, the Fermi Problem Library has worked problems with a step-by-step solver that explains the reasoning rather than printing an answer.
Next time you get a multi-stage question, draw the tree before writing any formula, and check the forks before checking the answer.


