On this page
If a rate law has two or three concentrations in it, one concentration-time curve cannot give you any single order, because every concentration changes at once. The isolation method fixes this by holding all but one concentration practically constant. Chemists still use Ostwald's name for it: a 2014 paper by Brigham and Meyer in The Journal of Physical Chemistry C opens its title with Ostwald Isolation to Determine the Reaction Order.
What is the Ostwald isolation method?
Write the unknown rate law as rate = k[A]^α[B]^β[C]^γ. The isolation method is performed by using large excess concentrations of all reactants but one, as Roberto Peverati's Chemistry LibreTexts chapter puts it.
If B and C are in large excess, [B] and [C] hardly change during the run. Fold them into a new constant, k' = k[B]^β[C]^γ, and the rate law shrinks to rate = k'[A]^α. The reaction now behaves as if A were the only reactant, and α is the pseudo-order with respect to A. Hydrolysis in water is the textbook case, covered in our post on pseudo first-order reactions such as ester hydrolysis.
How much excess counts as a large excess?
A minimum 20-fold excess is necessary as a general rule, and a 50-fold or 100-fold excess is preferable, according to David N. Blauch's isolation method page for Davidson College.
His example uses 0.100 mol/L hydroxide with 0.00100 mol/L CH3Br, a 100-fold excess. Even when all the CH3Br reacts, [OH-] changes by only 1%, which is often comparable to or smaller than the experimental error.
How do you find the order of reaction step by step?
Pick one reactant to isolate. Take every other reactant in at least 20-fold excess, ideally 50 to 100-fold.
Measure the concentration of the isolated reactant over time.
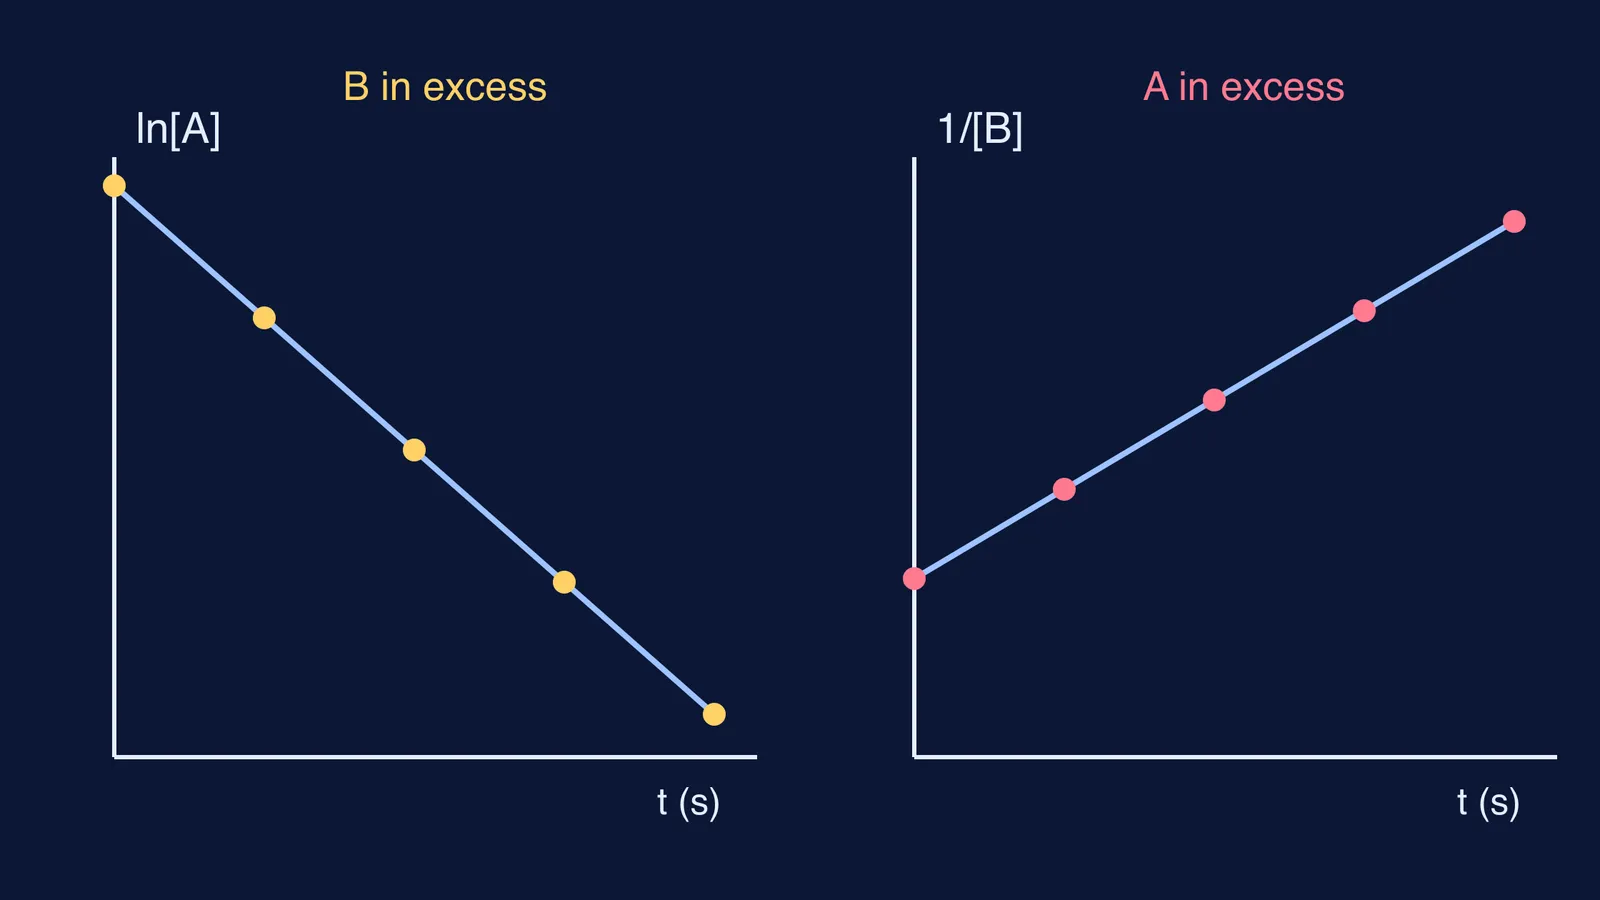
Plot [A] vs t, ln[A] vs t and 1/[A] vs t. The straight one gives the pseudo-order: zero, first or second. See our guide to reading reaction order from integrated rate law graphs.
Read k' from the slope.
Repeat, isolating each other reactant in turn.
Add the orders for the overall order. Recover k by dividing k' by the excess concentrations raised to their orders.
For step 2 you can also measure initial rates instead of the whole curve, as in our post on finding the order from initial rates data.
Worked example: A + B → products
These numbers are made up for practice, not lab data.
Run 1, B in excess: [B] = 1.00 M, [A]0 = 0.0100 M.
t = 0 s: [A] = 0.0100 M
t = 10 s: [A] = 0.00607 M
t = 20 s: [A] = 0.00368 M
t = 30 s: [A] = 0.00223 M
Every 10 s, [A] falls by the same factor, 0.607, so ln[A] drops by 0.50 each time. The ln[A] plot is straight: first order in A, with k' = 0.050 s^-1. At most 0.0100 M of B is used out of 1.00 M, so treating [B] as constant is safe.
Run 2, A in excess: [A] = 1.00 M, [B]0 = 0.0100 M.
t = 0 s: [B] = 0.0100 M
t = 1000 s: [B] = 0.00667 M
t = 2000 s: [B] = 0.00500 M
t = 3000 s: [B] = 0.00400 M
The ratios between readings are 0.667, 0.750 and 0.800, not constant, so it is not first order. But 1/[B] goes 100, 150, 200, 250 M^-1, rising by exactly 50 every 1000 s. That straight line means second order in B, with k'' = 0.050 M^-1 s^-1.
So rate = k[A][B]^2, overall order 3. From run 1, k = k'/[B]^2 = 0.050/(1.00)^2 = 0.050 M^-2 s^-1. From run 2, k = k''/[A] = 0.050/1.00 = 0.050 M^-2 s^-1. Two runs giving the same k is your check.
Where do students go wrong with the isolation method?
Reporting the pseudo-order as the overall order.
Forgetting that k' contains the excess concentrations, so its units differ from those of k.
Using a small excess, then wondering why no plot is straight.
Testing only the ln plot and calling everything first order.
If you get the orders but the units of k keep slipping, work through kinetics problems in the Fermi Problem Library, where a step-by-step solver explains the reasoning rather than printing an answer. If the integrated rate laws are the weak link, the Fermi Concept Library gives each concept its own lesson.
Next time a question says one reactant is in "large excess", write k' first, then find one order at a time.