On this page
A question shows you a graph and asks whether the function is one-one. Slide a ruler across it, keeping it horizontal. If it ever touches the curve in two places, the function is not one-one. Here is why that works, how to turn it into a full answer in a Class 12 or JEE paper, and the trap that is easy to miss: the domain.
What does the horizontal line test check?
The Class 12 NCERT textbook (Chapter 1, Definition 5) calls a function f: X → Y one-one, or injective, if the images of distinct elements of X are distinct: f(x₁) = f(x₂) implies x₁ = x₂ (NCERT Mathematics Part I, Chapter 1). Otherwise the function is called many-one.
A horizontal line y = c contains every point whose output is c. So the number of times that line meets the graph is the number of inputs that give the output c. Two crossings means two different inputs sharing one output, exactly what the definition forbids.
OpenStax College Algebra states the rule directly: if any horizontal line intersects the graph more than once, the graph does not represent a one-to-one function (OpenStax College Algebra 2e, Section 3.1). The vertical line test in the same section checks something different: whether a graph is a function at all.
Why does a parabola fail the horizontal line test?
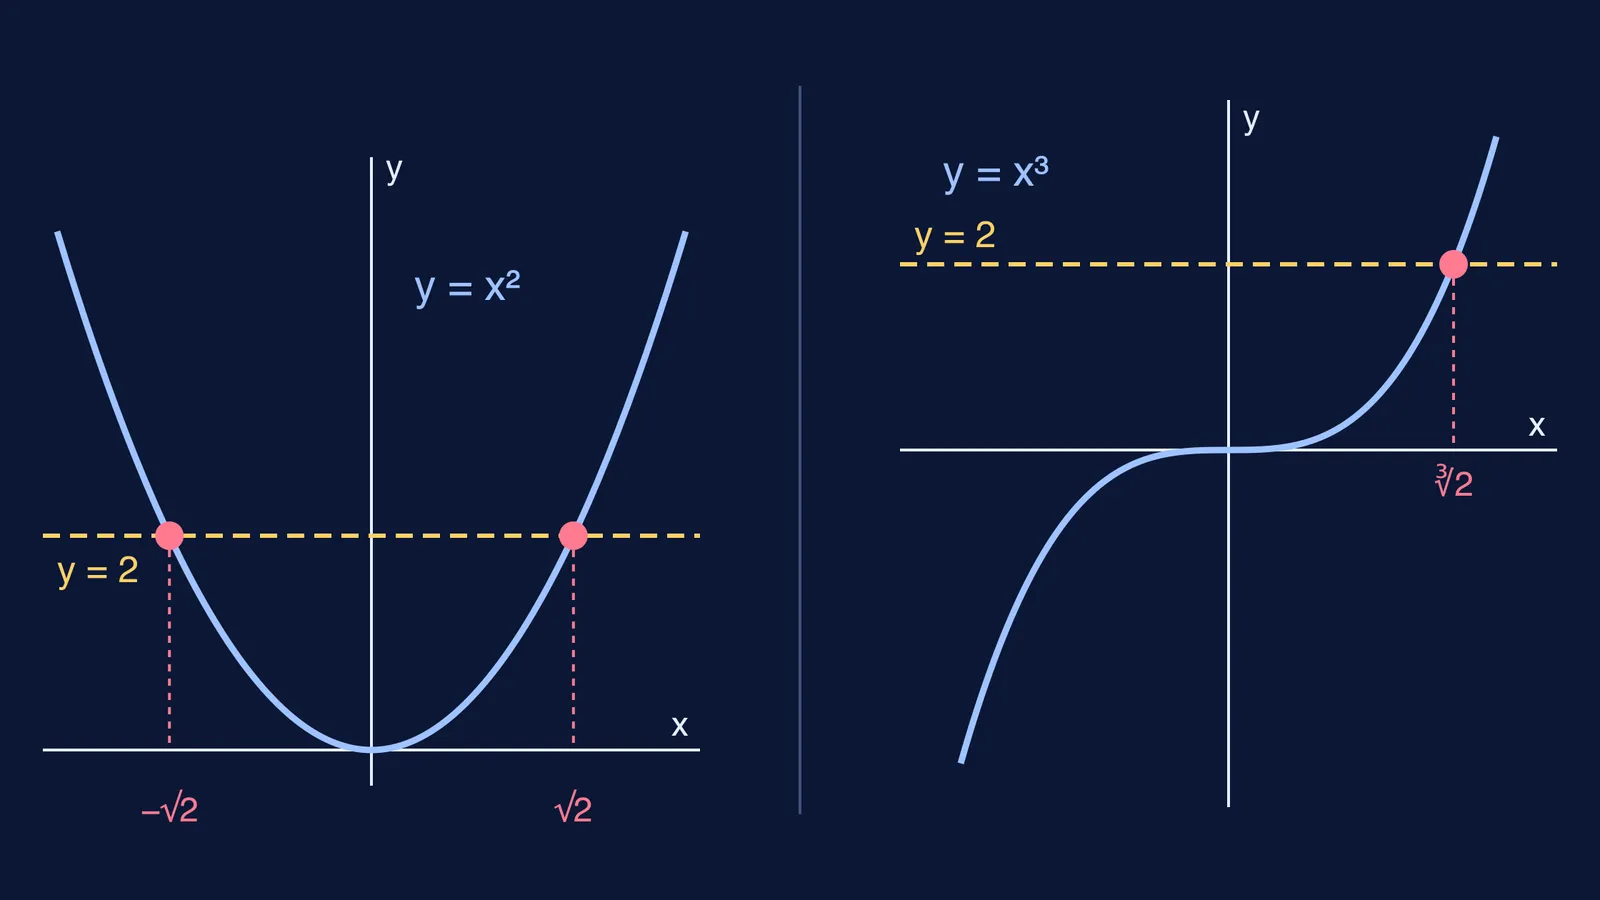
Take f(x) = x² on the real numbers. Draw the line y = 2. It meets the parabola at x = −√2 and x = √2, two different inputs with the same output 2. That single line is enough: f is not one-one.
NCERT makes the same argument in Example 11 of that chapter, using the line y = 1: since f(−1) = 1 = f(1), the function is not one-one (NCERT Chapter 1).
Now take f(x) = x³. The curve keeps rising, so every horizontal line meets it exactly once. This function passes.
How do you use the horizontal line test in an exam?
A graph is evidence, not proof. Use this routine so the picture turns into marks.
Write down the domain first. The same rule can pass on one domain and fail on another.
Sketch accurately. Find where f′(x) = 0; near a turning point, a horizontal line can cross twice.
Slide a horizontal line from bottom to top and watch for a second crossing.
If it fails, name two inputs: "f(a) = f(b) with a ≠ b, so f is not one-one". That is a complete proof.
If it passes, prove it: start from f(x₁) = f(x₂) and show x₁ = x₂, as NCERT does for f(x) = 2x in Example 9. Or, when the domain is an interval, show f′(x) > 0 (or < 0) throughout it, since a strictly increasing or decreasing function never repeats an output.
If steps 4 and 5 are where you get stuck, the Fermi Problem Library has worked problems with a step-by-step solver that explains the reasoning rather than printing an answer.
Does the domain change the answer?
Yes. NCERT Exercise 1.2 asks you to check f(x) = x² separately on N, Z and R (NCERT Chapter 1).
On N, the graph is separate rising dots at x = 1, 2, 3 and so on. No horizontal line meets two dots, so it is one-one.
On Z, the dots at x = −2 and x = 2 sit at the same height 4. Not one-one.
On R, the full parabola fails.
Restricting x² to x ≥ 0 keeps only the right half of the parabola, which passes. That is the first step towards an inverse; see our guide to finding an inverse and reflecting its graph.
Which common functions pass and which fail?
Try each one before reading the answer.
f(x) = x³ − 3x on R: fails. It turns at x = −1 and x = 1, and f(−√3) = f(0) = f(√3) = 0, so the x-axis crosses it three times.
f(x) = x³ + x on R: passes. f′(x) = 3x² + 1 is always positive.
f(x) = [x], the greatest integer function: fails. The line y = 0 runs along the whole step from 0 to 1.
f(x) = sin x on R: fails, since sin 0 = sin π = 0. On [−π/2, π/2] it passes, which is why inverse sine uses that interval.
What the test does not tell you
Passing the horizontal line test says nothing about onto. NCERT's Example 8 shows f(x) = 2x from N to N is one-one but not onto, because no natural number maps to 1 (NCERT Chapter 1). Onto depends on the co-domain, not the shape of the curve. Our post on one-one and onto functions in Class 12 covers both tests side by side.
If domain, co-domain and range still blur together, the Fermi Concept Library gives each concept in mathematics its own lesson and its place in the map. Then open Exercise 1.2 and slide that ruler across a few graphs yourself.