On this page
Health can feel like a "common sense" chapter, so students often study it least and lose easy marks. Chapter 3 of Class 8 science is more precise than it looks: it separates signs from symptoms, communicable from non-communicable diseases, and vaccines from antibiotics. This post explains those ideas, works through the chapter's dengue data question with sample numbers, lists common mistakes, and gives a short routine. It is written for Class 8 students and their parents, and it is not medical advice.
Where is this chapter in the new book?
In the current NCERT book Curiosity, Textbook of Science for Grade 8 (reprint 2026-27), Chapter 3 is "Health: The Ultimate Treasure". It follows Chapter 2 on the invisible living world of microorganisms. The Chapter 3 PDF moves from what health means, to staying healthy, to how diseases are caused, spread, prevented and treated.
What does "health" mean in this chapter?
The chapter uses the World Health Organization's definition. In the WHO Constitution, health is "a state of complete physical, mental and social well-being and not merely the absence of disease or infirmity".
The chapter opens with a story that makes this concrete. A Grade 8 student moves to a new city, feels lonely, spends more time on his phone, and starts having headaches and trouble sleeping. A doctor advises less screen time and a counsellor helps him make friends. Nothing in the story is a germ, yet his health suffered. If you or your child ever feel like that boy, talk to a parent, teacher or school counsellor. In India, the government's free mental health helpline Tele MANAS can be reached on 14416 or 1-800-891-4416.
What is the difference between a sign and a symptom?
This is a favourite short-answer question. The chapter says a symptom is what we feel, like pain or tiredness. A sign is something that can be seen or measured, like a high temperature or a rash.
Which diseases spread, and which do not?
Communicable diseases are caused by pathogens: bacteria, viruses, fungi, protozoa or worms. They spread through air, contaminated food and water, direct or indirect contact, or vectors such as mosquitoes and houseflies. The chapter's Table 3.1 lists examples: cold and flu, chickenpox, measles and tuberculosis by air; hepatitis A, cholera, typhoid and roundworm by food and water; malaria and dengue by mosquitoes.
Non-communicable diseases such as diabetes, cancer and asthma are not caused by pathogens and do not pass from person to person. The chapter links them to lifestyle, diet and environment, says they are now the most common cause of death in India, and calls those lasting more than three months chronic. Deficiency diseases like scurvy and anaemia are also non-communicable.
Does handwashing really make a difference?
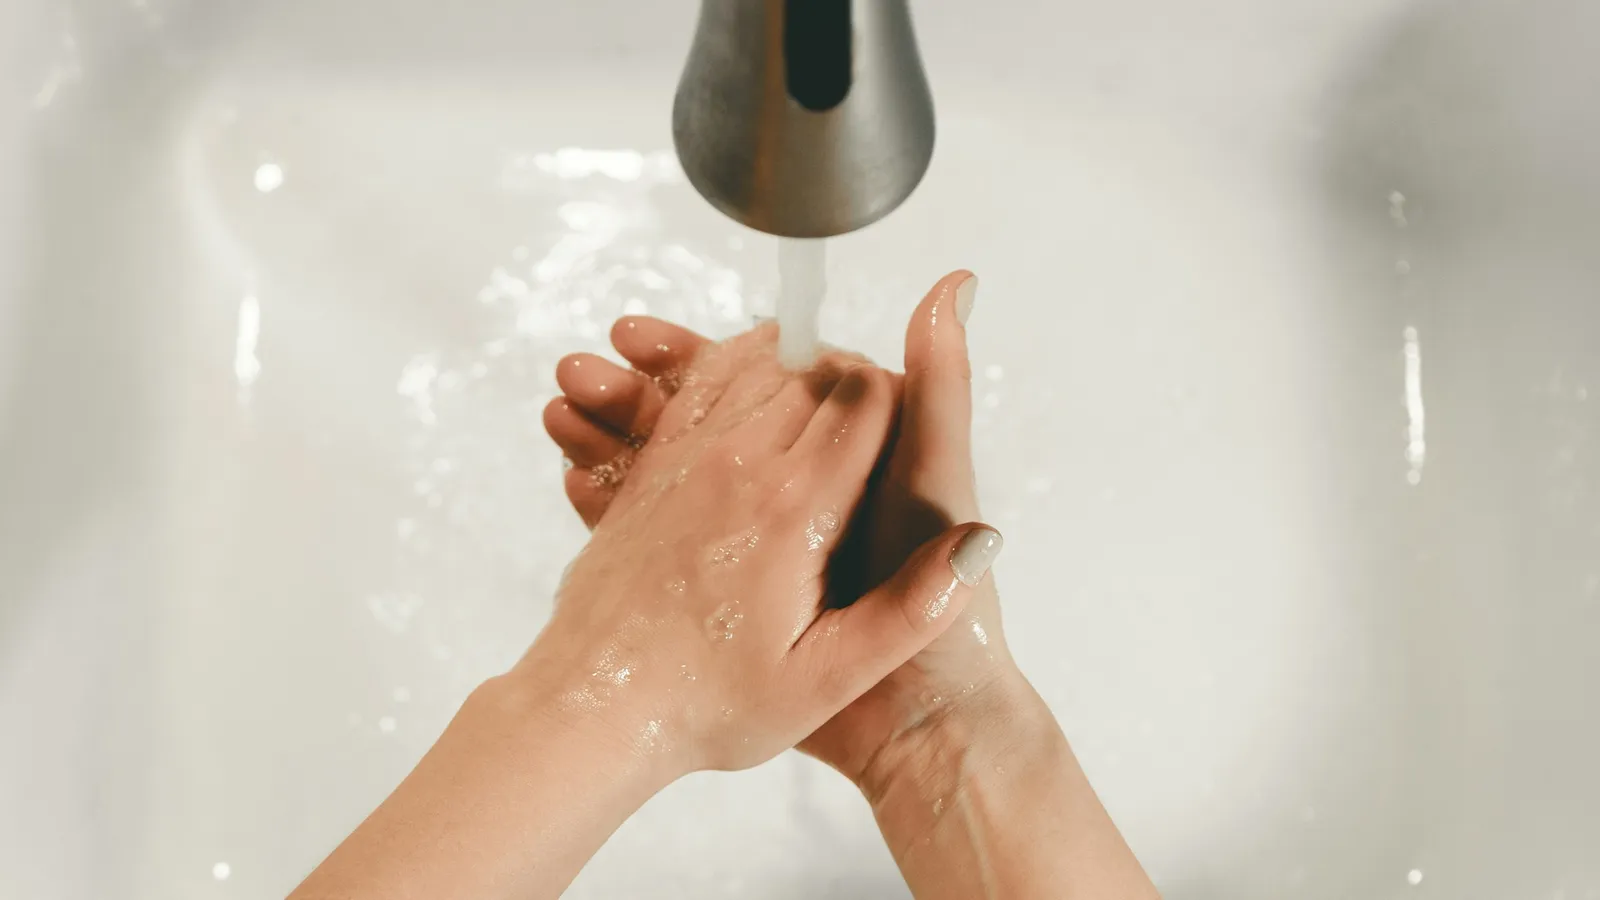
Yes, and the size of the effect has been measured. A meta-analysis of 30 community studies by Aiello and colleagues (2008) found that better hand hygiene reduced gastrointestinal illness by 31% and respiratory illness by 21%. The most useful approach was hand-hygiene education with ordinary soap; antibacterial soap added little benefit over plain soap.
How are vaccines and antibiotics different?
Students often mix these up, so learn the chapter's distinction:
A vaccine trains the immune system before infection, giving acquired immunity. It is preventive, not a cure. The chapter tells the story of Edward Jenner and cowpox, and of India's older practice of variolation.
An antibiotic kills bacteria after infection. It does not work on viruses or protozoa, so it will not cure a cold or flu.
Misusing antibiotics causes antibiotic resistance, where bacteria survive drugs that used to kill them. The WHO fact sheet on antimicrobial resistance says that approximately 1 in 6 laboratory-confirmed bacterial infections worldwide were resistant to antibiotics in 2023. The chapter's advice: use antibiotics only when prescribed by a doctor, in the right dose, for the full duration.
Worked example: reading a dengue graph
Question 7 asks you to plot monthly dengue cases from a hospital and analyse them. Here is how to approach it with sample numbers (not from the book):
January 4, February 3, March 2, April 3, May 5, June 12
July 30, August 48, September 55, October 36, November 14, December 6
Step 1. Plot it. Months on the x-axis, cases on the y-axis, one bar per month. A scale of 1 cm for 10 cases fits on a notebook page.
Step 2. Highest three months. September (55), August (48) and October (36).
Step 3. Lowest month. March (2).
Step 4. Total and share. Total for the year = 4 + 3 + 2 + 3 + 5 + 12 + 30 + 48 + 55 + 36 + 14 + 6 = 218. The three peak months add up to 55 + 48 + 36 = 139, which is 139 ÷ 218 ≈ 64% of the year's cases.
Step 5. Explain it. Dengue is spread by mosquitoes, so think about when standing water is common. The chapter's own notice board carries a headline linking the arrival of the monsoon to more malaria and dengue cases. Then suggest action before the peak: clearing stagnant water, nets and repellents, as Table 3.1 says.
What mistakes cost marks?
Calling diabetes or asthma infectious.
Saying antibiotics cure viral fevers.
Mixing up signs and symptoms.
Describing health as "not being sick", which the WHO definition rejects.
Calling vaccines a treatment rather than prevention.
A practice routine
Make two lists from memory: communicable and non-communicable diseases, with how each spreads or what causes it. Check against Table 3.1.
Explain vaccine versus antibiotic to a family member in under a minute.
Keep a one-week health diary, as the chapter's projects suggest: sleep, food, exercise, screen time and mood.
Answer three end-of-chapter questions a day without the book, then check.
Chapter 2 on microorganisms sets up this one. Our post on microorganisms in Class 8 covers it, and Louis Pasteur and germ theory tells the history.
If a term such as immunity or pathogen keeps slipping, the Fermi Concept Library covers every concept in physics, chemistry, biology, mathematics and computing, so you can read a clear explanation before trying the questions again.
Tonight, plot Question 7 with the sample numbers above and write two lines explaining the peak.