

On this page
According to the National Council of Educational Research and Training (NCERT), a frequency distribution table is a systematic way of organizing raw data to show the number of times (frequency) each value or interval appears. It turns an overwhelming list of numbers into a clear summary.
When you have a lot of data—such as the marks of an entire class—listing every single number is messy. Instead, you create groups (called class intervals) and use tally marks to count how many data points fall into each group.
What are the types of frequency distribution?
There are two main types of frequency distribution tables, depending on the size of your dataset.
1. Ungrouped frequency distribution table This method is used when you have a small dataset with a limited number of unique values. Instead of creating intervals, you list each unique value and record its frequency. For example, if you are recording the blood groups (A, B, O, AB) of a class of students, you would list the four blood groups and tally how many students have each type.
2. Grouped frequency distribution table This is used for large datasets with many different values. Educational platforms like BYJU'S demonstrate this using large datasets, such as the heights of 50 students ranging from 150 cm to 173 cm. For this data, intervals of 5 cm work best:
150 – 155
155 – 160
160 – 165
How to choose class intervals?
Before counting, you need to set up the groups. The difference between the highest and lowest values in your raw data is called the range. The width of your class interval (the difference between the upper and lower limits) should be chosen so that you have a manageable number of groups—usually between five and ten.
The NCERT rule for the upper limit
What happens to a student who is exactly 160 cm tall? Do they go in the 155–160 group or the 160–165 group?
The standard convention used in Indian mathematics textbooks is the exclusive method. An observation equal to the upper limit of a class is always placed in the *next higher* class. Therefore, a height of exactly 160 cm belongs in the 160–165 interval. It is excluded from 155–160 and included in 160–165, ensuring that every value belongs to exactly one class.
How to make a frequency distribution table with tally marks?
Let us walk through the process of building the table using the heights of the 50 students from BYJU'S.
Find the range: Identify the smallest (150 cm) and largest (173 cm) numbers in your raw data.
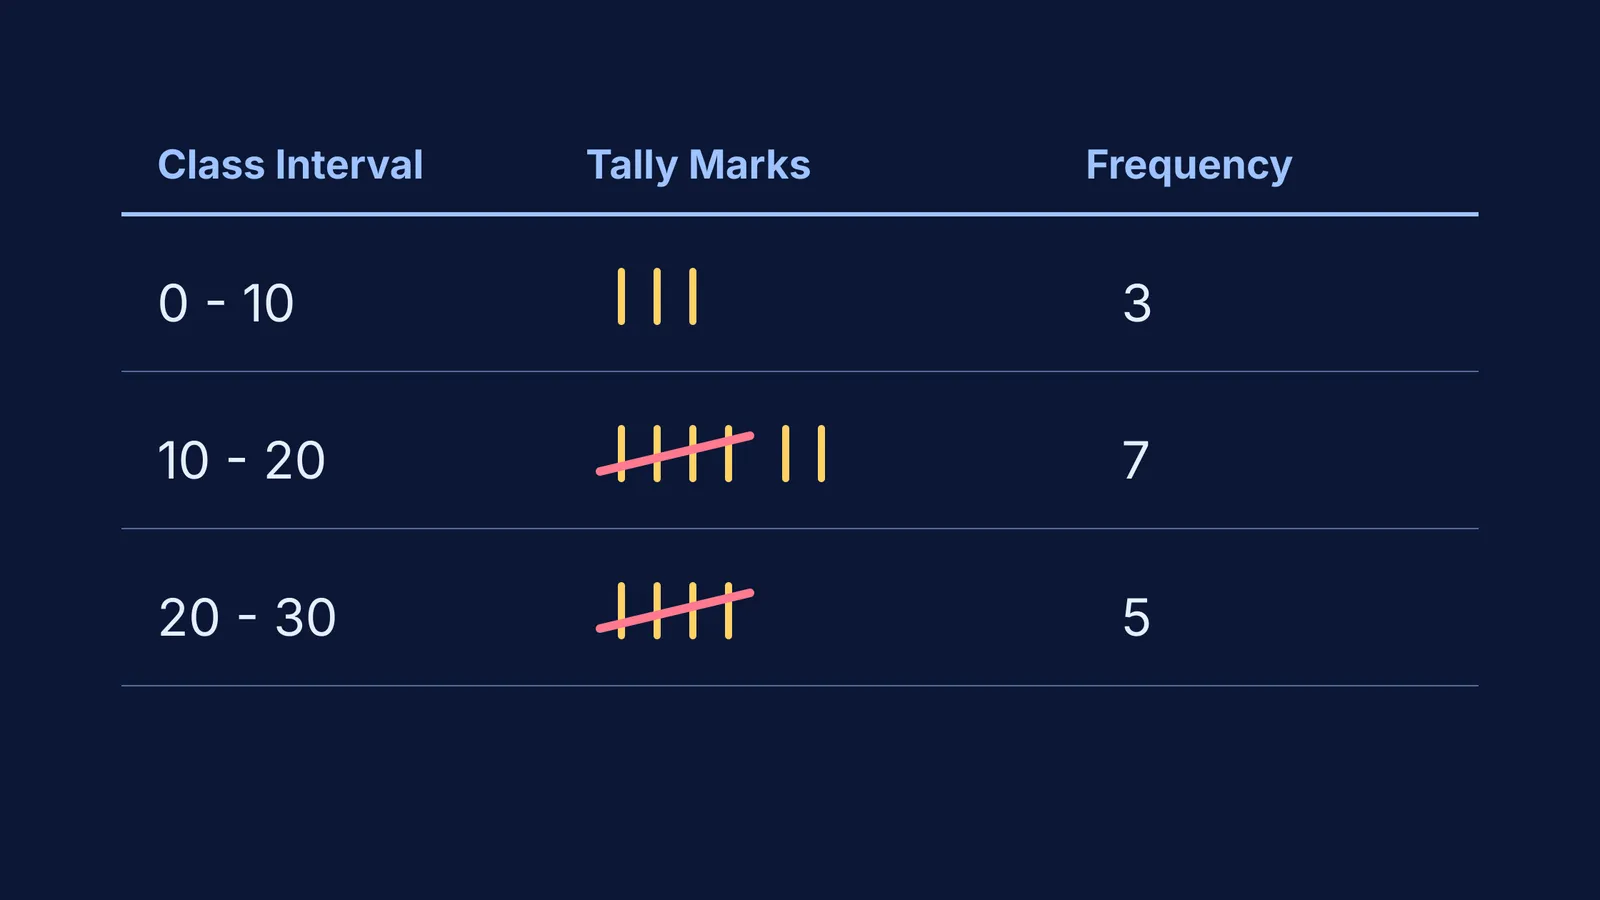
Set up the table: Create three columns labeled "Class Interval", "Tally Marks", and "Frequency".
Write the intervals: List the groups down the first column based on your chosen range.
Mark the tallies: Go through the raw data one by one. For each number, draw a vertical line (`|`) in the tally column of the correct interval. When you reach five, cross the previous four diagonally.
Count the frequency: Add up the tally marks for each row and write the number in the final column.
For example, 14 out of the 50 students land in the 160–165 cm interval. In your table, the tally marks for 14 would be drawn as two crossed bundles of five, followed by four single vertical strokes. Once complete, this grouped table allows you to quickly conclude that 35 out of the 50 students are shorter than 165 cm.
What happens to gaps in data?
Sometimes, data is grouped into discontinuous intervals, such as 31–35 and 36–40. In these cases, there is a gap between the upper limit of one class (35) and the lower limit of the next (36). To convert these into continuous classes, you find the gap (1), divide it by two (0.5), and then subtract 0.5 from every lower limit and add 0.5 to every upper limit. The classes then become 30.5–35.5 and 35.5–40.5, allowing you to plot continuous graphs without any gaps.
Once your frequency distribution table is complete, you might need to calculate the average of the grouped data. To do this, you find the class mark, which is the exact midpoint of each class interval. You can find it by adding the lower limit and the upper limit together and dividing by two. For the 150–155 interval, the class mark is 152.5 cm. This single number represents the entire group in further statistical calculations.
How to check that the frequencies add up?
The most important step is checking your work. Add up all the numbers in the "Frequency" column. The sum must exactly equal the total number of raw observations you started with. If you counted a full class of students, your frequencies must add to that exact number. If they do not, you have missed a data point or counted one twice.
If you find yourself stuck while organizing data or doing homework on Statistics in Class 9, the Fermi Problem Library has worked problems with a step-by-step solver that explains the reasoning rather than printing an answer.
Similarly, understanding the core concepts of grouped data—which build upon the foundations of Data handling in Class 6—is much easier when you can review the theory interactively. The Fermi Concept Library holds every concept in physics, chemistry, biology, mathematics and computing, each with its own lesson and its place in the map.


