On this page
Most Class 6 students can read a bar graph when every bar ends neatly on a grid line. The trouble starts when one picture stands for ten children, or when a bar stops halfway between two lines. This post explains what NCERT's new Class 6 chapter on data asks of you, works through scale problems with numbers, lists the common slips and ends with a practice plan.
What does the Class 6 data handling chapter cover?
Chapter 4 of Ganita Prakash, NCERT's Class 6 mathematics book (first edition August 2024, Reprint 2026-27), has five sections:
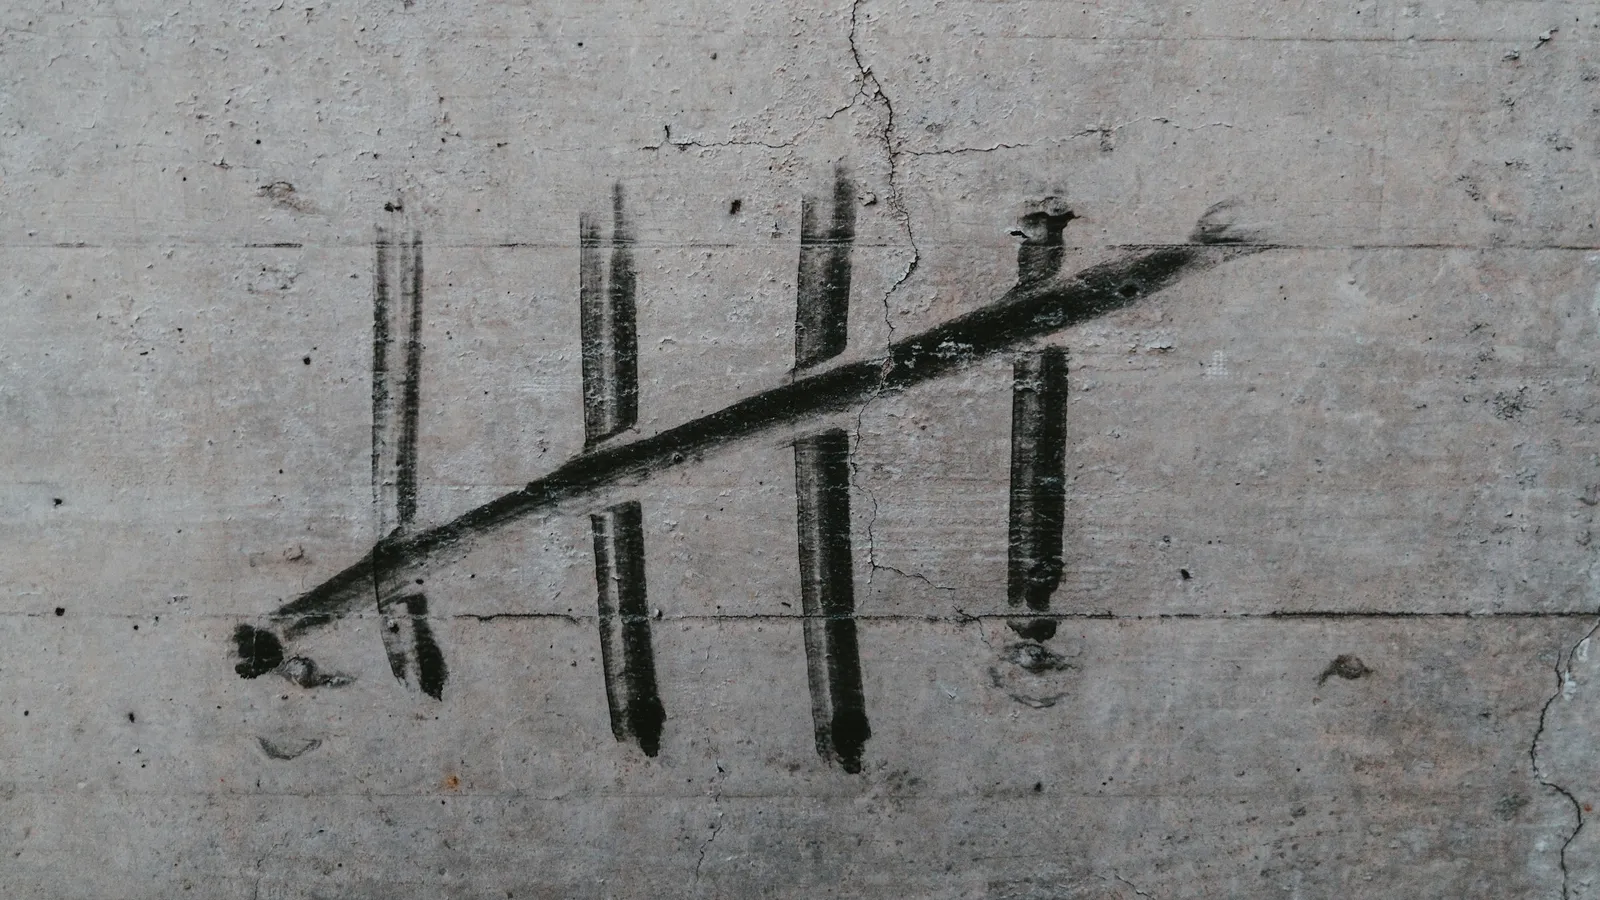
Collecting and organising data, with tally marks and frequency tables
Pictographs
Bar graphs
Drawing a bar graph
Artistic and aesthetic considerations, including infographics
The chapter summary defines data as facts, numbers, measures and observations that give information, and frequency as the count of how often each value occurs. The rest of the chapter is about showing those counts clearly.
How do you read a pictograph with a scale?
A pictograph uses a symbol for each item, or for a fixed number of items. That number is the scale or key, and the chapter says it must always be stated.
Worked example 1 (from the book). Nand Kishor asked children in his school how often they slept at least 9 hours. His pictograph uses one symbol for 10 children.
"Always" has 5 symbols: 5 × 10 = 50 children.
"Sometimes" has 2 full symbols and a half: 2 × 10 + 5 = 25 children.
"Never" has 4 symbols: 4 × 10 = 40 children.
The half symbol is the part students most often miss. Half a symbol is half the scale, so here it means 5 children.
Worked example 2. The chapter gives the kites Magan Bhai sold to six shopkeepers and asks for a pictograph with one symbol for 100 kites. Chaman bought 250, so Chaman's row has 2½ symbols. Poonam Ben bought 700, which is 7 symbols. Rani bought 300, which is 3 symbols.
The book then asks whether Rukhsana is right that Poonam Ben bought more than double Rani's kites. Double Rani's 300 is 600, and 700 is more than 600, so yes. You can see it straight from the symbols: 7 is more than 2 × 3.
How do you choose a scale for a bar graph?
In a bar graph, bars have the same width and equal gaps, and the length of each bar shows the number. When numbers are large, one unit of length stands for many items.
The chapter's traffic example uses 1 unit of length for 100 vehicles. The longest bar, for 7 to 8 a.m., shows 1200 vehicles, so it is 12 units long. For India's population over 50 years, it uses 1 unit for 10 crore people, so a bar 8 units long stands for 80 crore.
Worked example 3 (choosing your own scale). You survey favourite sports and get cricket 48, football 30, kabaddi 18 and badminton 12. Your graph paper allows bars of about 10 squares at most.
With 1 square for 1 student, cricket needs 48 squares. Too long.
With 1 square for 5 students, cricket is 48 ÷ 5 = 9.6 squares, football 6, kabaddi 3.6 and badminton 2.4. Fits, but most bars end between lines.
With 1 square for 6 students, the bars are 8, 5, 3 and 2 squares. Every bar ends on a line.
All three scales are correct. The third is the easiest to read, which is the kind of choice the chapter asks you to think about.
When should bars be vertical or horizontal?
The chapter's mountain example draws the tallest mountain on each continent. It argues that heights measured upwards, like mountains, look more natural as vertical bars, also called columns. Distances along the ground often suit horizontal bars. The same section warns that making a graph too fancy can sometimes mislead.
Why do some students find graphs harder than others?
Reading a graph is not only about the graph. In a study of 204 Grade 4 and 185 Grade 7 students, Frances Curcio (1987) gave students a prior-knowledge inventory, a graph test, and reading and achievement tests. Curcio identified significant predictors of graph comprehension at both grades and concluded that children should take part in graphing activities to build the background knowledge that comprehension needs. Watson and Moritz (2001) proposed four levels in how students arrange, interpret and predict from pictographs, which suggests the skill grows in stages rather than all at once.
In practice, this means making your own graphs from data you collected teaches more than only answering questions about printed ones.
Which mistakes cost the most marks?
Ignoring the scale. Counting symbols and forgetting to multiply.
Misreading half symbols. Half a symbol is half the scale.
Uneven bars or gaps. All bars should have the same width and equal spacing.
Unequal steps on the axis. The numbers along the axis must go up in equal jumps.
No title or labels. Every graph needs a title and named axes.
How should you practise this week?
Day 1: Survey 20 to 30 people on one question and record answers with tally marks.
Day 2: Make a pictograph of your data with a scale of 2 or 5.
Day 3: Draw a bar graph of the same data, choosing a scale that fits your page.
Day 4: Write five questions a friend could answer from your graph, then swap.
Day 5: Find a bar graph in a newspaper, write down its scale, and check one bar's value.
If a step such as choosing a scale still feels shaky, the Fermi Problem Library has a step-by-step solver that explains the reasoning rather than printing an answer. The same skills grow in Class 8, as our post on data handling in Class 8 shows.
Ask five friends their favourite fruit today and turn the answers into a pictograph with a scale.