

On this page
If you have ever looked at a wave graph and confused the shape of the line with the actual physical path of the object, you are not alone. In a landmark study of 895 high school and college students published in the *American Journal of Physics*, researchers found that misinterpreting graphs as pictures is one of the most common stumbling blocks in physics (Beichner, 1994). This becomes especially tricky when dealing with oscillations, where multiple kinematic variables change at once. To master these concepts, you need to understand not just algebraic formulas, but the geometric relationships hidden within the curves. When connecting these kinematic curves to underlying principles, the Fermi Concept Library organizes every concept in physics with its own lesson and its place in the topic map.
What is the phase relation between displacement, velocity, and acceleration in SHM?
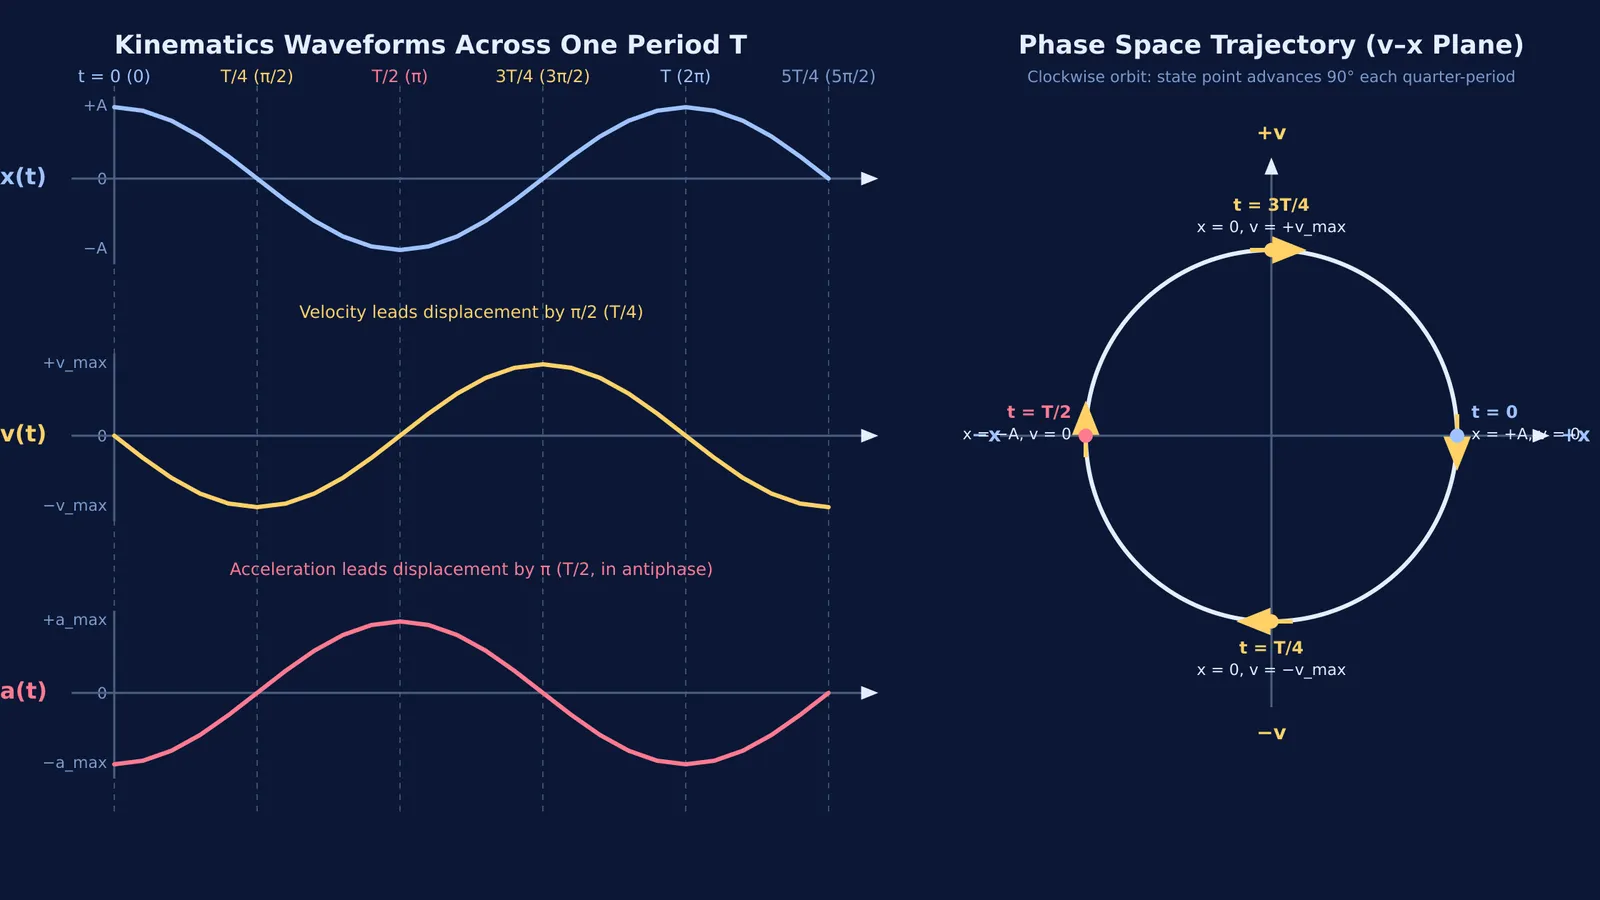
In simple harmonic motion (SHM), the object's displacement, velocity, and acceleration oscillate at the identical angular frequency ω, but their peaks and zeros are offset in time. According to *University Physics Volume 1* (OpenStax), velocity leads displacement by π/2 radians (90°), and acceleration leads displacement by π radians (180°).
When setting up simple harmonic motion problems, this mathematical phase difference translates directly into the physical state of the oscillator:
Displacement (x) is described by a cosine function, x(t) = A cos(ωt), assuming the motion begins at the positive maximum amplitude.
Velocity (v) is the first time derivative of displacement, v(t) = dx/dt = −Aω sin(ωt) = Aω cos(ωt + π/2), which shifts the waveform earlier by a quarter-cycle (π/2 radians or T/4).
Acceleration (a) is the second time derivative, a(t) = dv/dt = −Aω² cos(ωt) = Aω² cos(ωt + π), placing it entirely in antiphase (π radians or T/2) with displacement.
Consider a simple pendulum pulled aside to its maximum displacement. At the release point, the pendulum bob pauses for an instant, so its velocity is zero. However, the restoring force pulling the bob toward equilibrium reaches its peak magnitude at this point, which means acceleration is also at its maximum. As the bob swings through the center equilibrium position (zero displacement), it moves at its highest speed, but the restoring force vanishes, meaning acceleration drops to zero.
How do you read phase differences from a v–x ellipse?
While standard time-based plots stack these waves on top of each other, phase space provides an even clearer view of oscillatory dynamics. A phase space plot graphs velocity on the vertical axis against displacement on the horizontal axis.
For an object undergoing undamped SHM, this trajectory forms a closed ellipse, or a circle when velocity is scaled by angular frequency (v/ω). Picture a state point moving along this loop as time advances. At maximum positive displacement (the rightmost edge), velocity equals zero. As time moves forward, the state point travels downward and leftward in a clockwise direction. One quarter-cycle later, it crosses the vertical axis at zero displacement with maximum negative velocity.
Because the state point sweeps through 90 degrees (π/2 radians) of the orbital ellipse to travel from a displacement peak to a velocity peak, you can visually confirm that velocity leads displacement by a quarter-period.
Why do velocity and acceleration peak at different times?
It often seems puzzling that an oscillating mass can experience maximum acceleration at the precise moment its velocity is zero. The solution lies in separating current speed from the rate of change of speed.
In SHM, acceleration is dictated strictly by the net restoring force. Hooke's law states that the restoring force is proportional to displacement, F = −kx. By Newton's second law, acceleration must mirror displacement with an inverted sign, a = −(k/m)x = −ω²x. Velocity, by contrast, represents the accumulation of acceleration over time through integration. It takes a full quarter-cycle of sustained push for the acceleration to accelerate the mass up to its top speed at equilibrium. This continuous exchange between restoring forces and kinetic energy also dictates the shape of SHM energy graphs.
What is a checklist for solving SHM graph problems?
When solving kinematics exam questions, apply this step-by-step checklist alongside standard techniques for reading physics graphs to avoid confusing graph shapes with physical paths:
Identify the axes: Confirm whether the graph shows displacement against time (x–t), velocity against time (v–t), acceleration against time (a–t), or phase space (v–x).
Track the equilibrium crossings: Whenever the displacement curve crosses the zero axis, velocity must be at a positive or negative peak, and acceleration must be zero.
Check the slopes: The slope of the displacement curve at any instant equals the value of the velocity curve. A horizontal tangent on the displacement graph demands a zero value on the velocity graph.
Inspect the mirror relationship: The acceleration curve must be an exact upside-down replica of the displacement curve, scaled by the factor ω².
To work through step-by-step solutions for oscillatory kinematics, the Fermi Problem Library offers worked problems with a step-by-step solver that explains the reasoning rather than printing an answer.


