

On this page
When you walk through a dense forest, you might spot a dozen species of trees. If you walk into a nearby meadow, you might see a dozen species of wildflowers, but almost no trees. How do ecologists describe the biodiversity of the entire landscape versus the individual patches?
R. H. Whittaker defined beta diversity as the ratio of gamma diversity to alpha diversity in a 1960 paper (Whittaker, 1960). In his framework, biodiversity is not just a single number. Instead, it is a measurement taken at three different scales: alpha (α), beta (β) and gamma (γ).
What is alpha diversity?
Alpha diversity is the mean species diversity at a local scale or within a single community. If you count the number of distinct species in one specific pond, that is the alpha diversity of the pond.
Because it only looks at a local area, alpha diversity is highly specific to the environment. A 2020 study of 11,680 samples from the Earth Microbiome Project found that soils contain the highest bacterial richness within a single sample, making them the habitat with the highest alpha diversity (Walters & Martiny, 2020).
What is beta diversity?
Beta diversity measures the differentiation or turnover of species between two or more local sites. If you move from the pond to a nearby stream, beta diversity tells you how much the species composition changes.
If the pond and the stream have exactly the same species, the species turnover is zero. If they share no species at all, the turnover is high. Whittaker originally calculated beta diversity as a ratio: how many times more species there are in the whole region than in an average local site. Today, ecologists use various mathematical indexes to calculate beta diversity, but the core idea remains the turnover of species.
What is gamma diversity?
Gamma diversity is the total species diversity across a large region or landscape. It encompasses all the different habitats within that area. Returning to the global bacterial example, while soils have the highest alpha diversity, sediment assemblages were found to be the most diverse at a global scale, meaning they have the highest gamma diversity (Walters & Martiny, 2020).
How to count them: a worked example
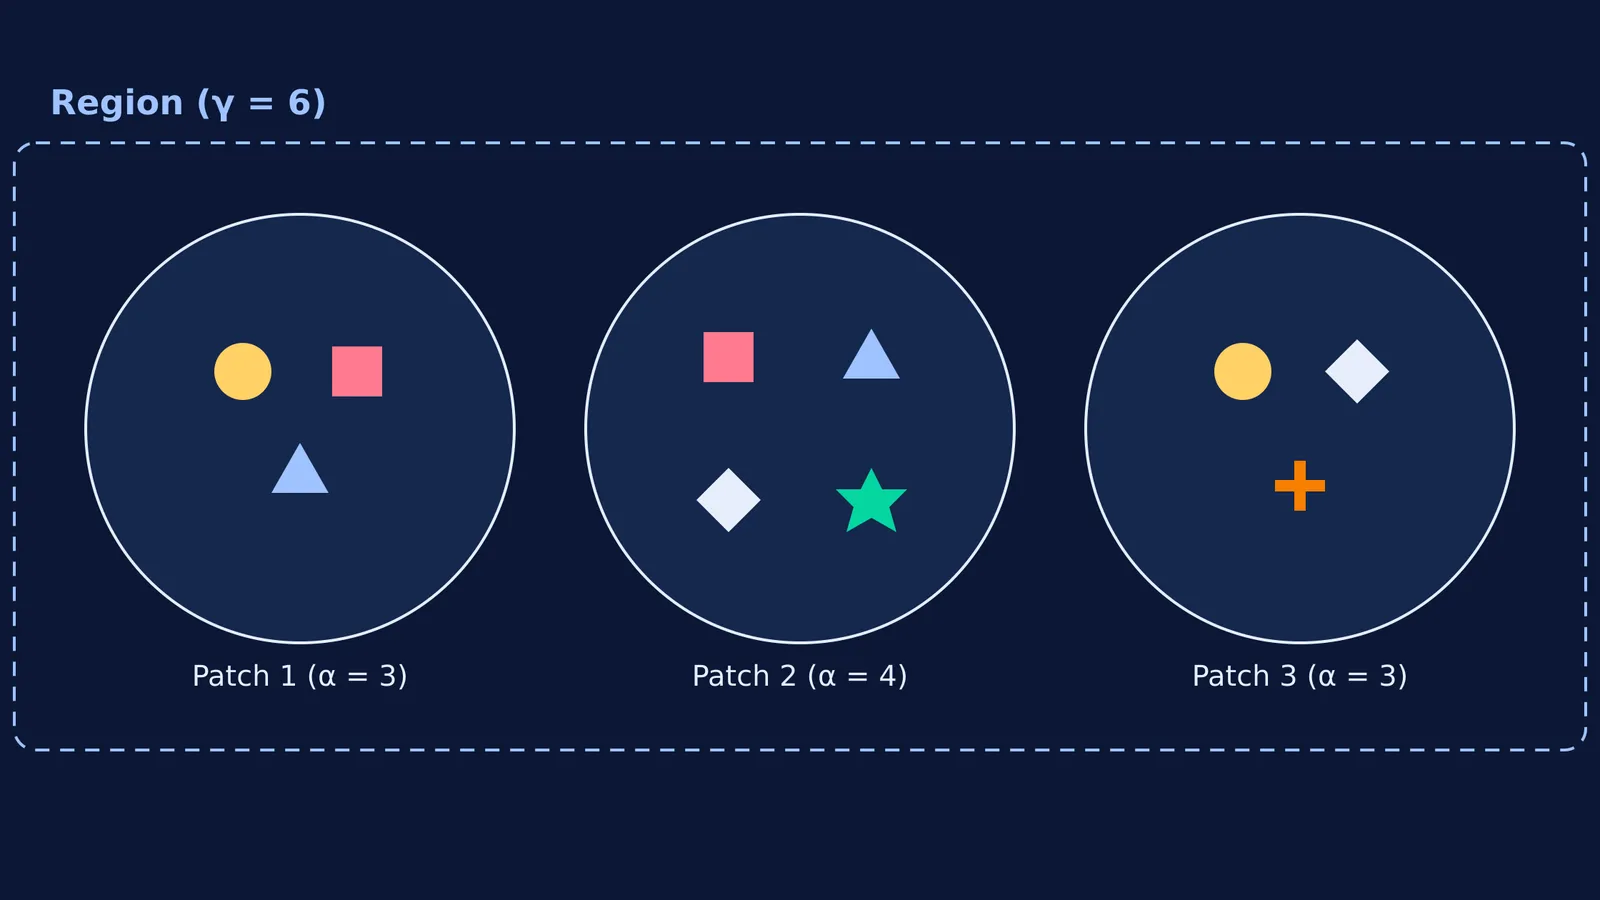
Let us look at a landscape with three different patches of land. We will count the species in each.
Patch 1 (Forest): Oak, Pine, Fern (3 species)
Patch 2 (Edge): Pine, Fern, Moss, Lichen (4 species)
Patch 3 (Grassland): Oak, Moss, Grass (3 species)
1. Finding Alpha (α) diversity: Alpha is the diversity within each patch. To find the alpha diversity of the landscape, ecologists take the mean alpha diversity across the patches.
α₁ = 3
α₂ = 4
α₃ = 3
Mean α = (3 + 4 + 3) / 3 = 3.33.
2. Finding Gamma (γ) diversity: Gamma is the total number of unique species across the entire landscape.
The complete list is: Oak, Pine, Fern, Moss, Lichen, Grass.
γ = 6.
3. Finding Beta (β) diversity: Using Whittaker's original multiplicative formula (β = γ / mean α):
β = 6 / 3.33 = 1.8.
This gives a beta diversity of 1.8. A higher value means the habitats differ more from one another.
Why do these scales matter for conservation?
Understanding alpha, beta and gamma diversity changes how we protect natural spaces. If a region has high alpha diversity but low beta diversity, it means every patch of land is rich in species, but they all contain the same species. In this case, protecting one large reserve might be enough to save most of the region's biodiversity.
However, if a region has high beta diversity, it means species change rapidly from one patch to the next. Even if each individual patch has few species (low alpha diversity), the region as a whole might have a massive number of unique organisms. To conserve this landscape, you must protect multiple small reserves across different habitats, rather than just one large area.
Why do these scales matter for exams?
Ecology questions in NEET and board exams often test whether you understand the scope of these terms. A common trap is confusing beta diversity (a comparison between sites) with alpha diversity (a flat count at one site).
If you are struggling to keep these ecological scales straight alongside concepts like stabilising, directional and disruptive selection or biological magnification, the Fermi Concept Library breaks down every concept in physics, chemistry, biology, mathematics and computing. Each has its own lesson and its place in the map, helping you see how populations, communities and ecosystems connect.
When you sit down to solve a problem set, Fermi's AI tutor works out what you already know, builds a plan for the session, and teaches through it. Instead of just giving you the final answer, it explains the reasoning step by step, so you are ready for the exam. For more on how species are grouped, read about viruses, viroids and lichens.


