

On this page
For many students who excel in theoretical physics, the experimental round of an olympiad is terrifying. You might be able to integrate a complex equation, but correctly aligning a laser or estimating the reading error of a digital multimeter requires an entirely different set of skills.
The challenge is that school laboratories rarely teach these skills effectively. A study of two large introductory physics courses by Carl Wieman and N. G. Holmes found that traditional physics labs had almost zero statistically measurable benefit on students' conceptual understanding, changing exam scores by less than 2%.
Because traditional labs often focus on following a recipe to get a known answer, they do not prepare you for the open-ended problem-solving of an olympiad. To succeed, you have to build these skills independently. Here is how to start.
Why is error analysis so important?
In an olympiad experiment, a measurement without an uncertainty estimate is considered incomplete. If you calculate a value for the acceleration due to gravity, you have not proved whether your result agrees with the accepted value unless you also know your error margin.
Start by mastering the difference between reading errors and systematic errors. A standard ruler has a reading error of half its smallest division. But if you use a stopwatch, your human reaction time introduces a random error that completely dominates the digital reading error of the watch.
Once you have your raw uncertainties, you must propagate them through your calculations. The simplest accepted way in most olympiads is the max-min method. If you calculate a value f from several variables, recalculate it using the maximum possible values of your inputs (f_max), then the minimum (f_min). The uncertainty is Δf = max(f_max − f, f − f_min).
If you get stuck on the mathematics of propagating errors, the Fermi Problem Library has worked problems with a step-by-step solver that explains the reasoning rather than printing an answer, making it easier to trace how uncertainties combine.
How do you handle graph plotting?
Olympiad experiments almost always require you to linearise a theoretical equation and plot a graph. If the theory says the period of a pendulum is T = 2π√(L/g), you do not plot T against L. You plot T² against L so that the gradient of your straight line is 4π²/g.
When plotting, follow these rules:
Scale: Choose a scale that uses most of the graph paper.
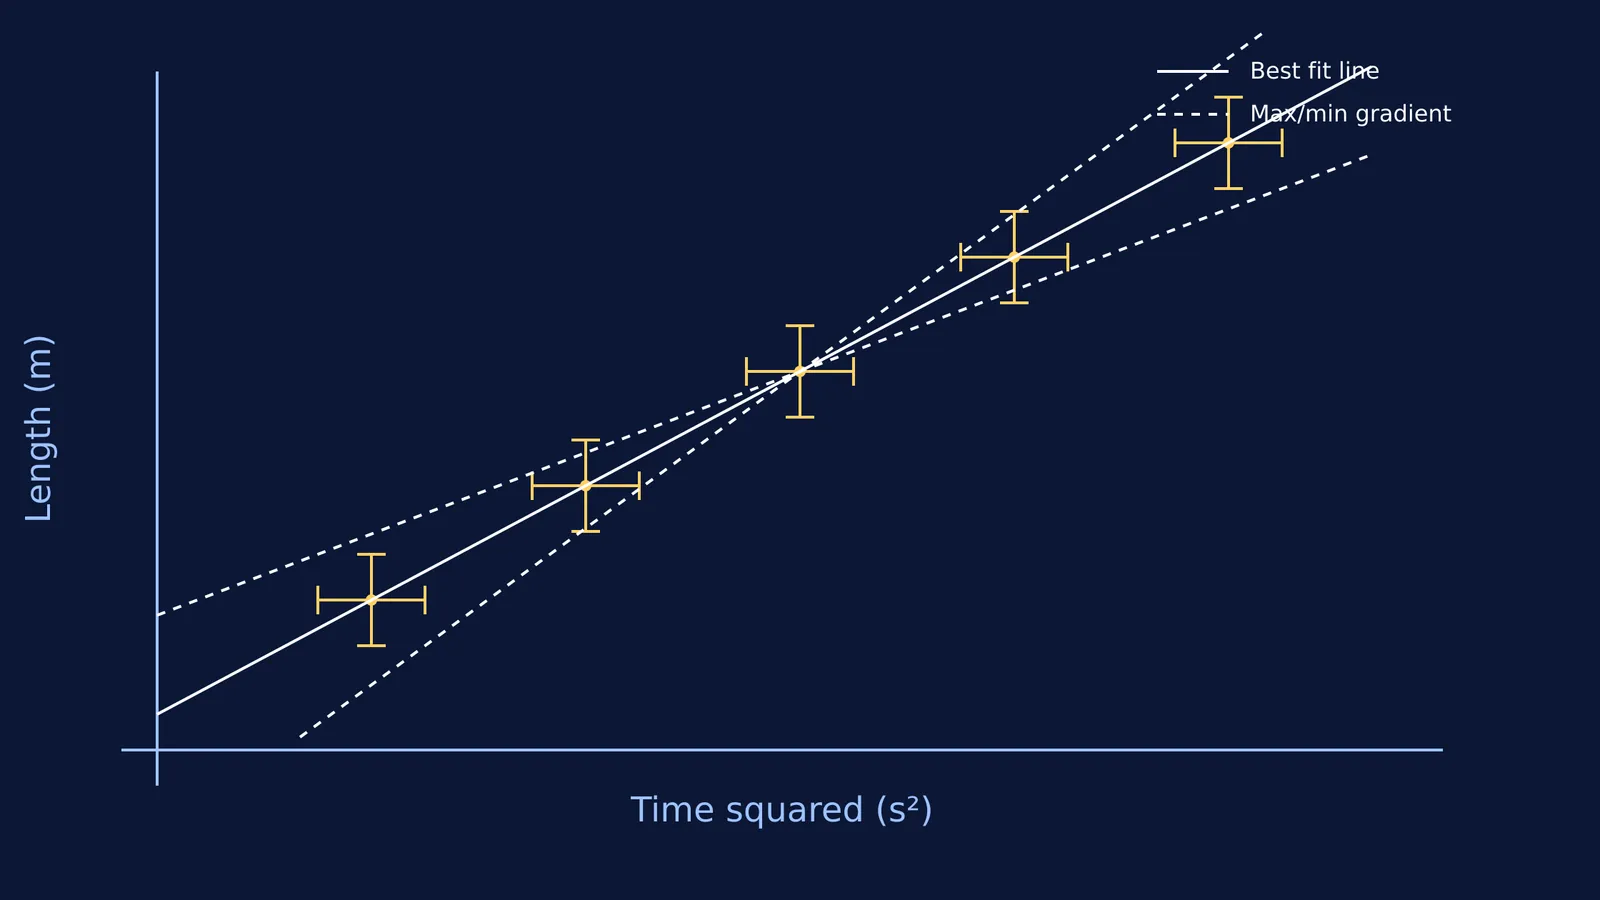
Error bars: Draw horizontal and vertical error bars for every point based on your raw uncertainties.
Best-fit line: Draw a single straight line that balances the points, with roughly equal numbers of points above and below the line.
Error envelope: To find the uncertainty in your gradient, draw the steepest possible line that still passes through the error bars of your first and last points, and then draw the shallowest possible line. The difference between these slopes gives you the error in the gradient.
If you struggle to picture how changing a variable alters a graph, you can use the Fermi Simulation Lab, which provides interactive simulations for the ideas that are easier to see than to read. You can also read our guide to the prism i-d curve experiment to see these graphing principles applied to a real setup.
How can you practise home experiments?
You do not need a university laboratory to prepare. The most vital skill—deciding how to take data to minimise error—can be practised with household items.
Try recreating classic school setups at home, like tracing a ray through a glass slab, using a laser pointer, some pins and a thick piece of clear plastic.
When practising, focus on your data strategy:
Range: Are you taking readings over the widest possible range? If your ruler is long, do not cluster all your measurements in a small section.
Repeats: Do not take a single reading. Drop a ball several times, measure the time for multiple pendulum swings instead of one, and average the results. This reduces random error and gives you a standard deviation to work with.
Clean tables: Before you touch any equipment, spend time drawing your data tables with a ruler, including columns for raw data, calculated values and their uncertainties.
If you want to read more about how scientists reformed physics teaching to focus on these active skills, our profile on Carl Wieman explores the research behind modern science education.


