

On this page
Most physics students are told to "draw a diagram", make a quick sketch, then go straight to the formula. Research says the sketch is worth more than that, but only some kinds of drawing help.
Why do diagrams help you learn physics?
A diagram groups information by where it sits on the page. In a 1987 paper in Cognitive Science, Jill Larkin and Herbert Simon argued that a diagram often puts the information you need for an inference together in one place, while text makes you search for it and work it out. On a free-body diagram, every force on a block sits around that block. In a word problem, the same forces are scattered across three sentences.
Drawing is also a way of learning, not just a way of showing what you know. In a 2011 article in Science, Shaaron Ainsworth, Vaughan Prain and Russell Tytler argued that emerging research supports treating drawing as a key element of science education.
Do students who draw diagrams score better?
The clearest physics evidence comes from free-body diagrams. In a two-year study published in 2009, David Rosengrant, Alan Van Heuvelen and Eugenia Etkina found that students who drew free-body diagrams correctly were significantly more successful at getting the right answer. In a course that kept emphasising these diagrams, most students drew them in exams even when they earned no marks for them.
Interviews showed a difference worth copying: high-achieving students used the diagram to solve the problem and to check their work, while low-achieving students used it only as an aid while solving.
When Patrick Kohl and Noah Finkelstein interviewed expert and novice physicists solving problems, both groups used multiple representations. Experts were more flexible about where to start and switched between representations more quickly; novices moved through more of them in total. They concluded that counting representations is not enough; purpose matters too.
What makes a diagram actually help?
Drawing alone guarantees nothing. A 2025 meta-analysis by Detlev Leutner and Johanna Biele pooled 14 studies (16 comparisons, 1,213 learners) on support for learning by drawing. Support in general was not related to learning outcomes. Support designed to help students integrate the words and the picture, such as comparing their drawing with a provided illustration, significantly improved comprehension (g = 0.35); other support had no significant effect (g = -0.15).
Our earlier post on why drawing the diagram first helps you solve physics problems also covers when a prompt to draw can backfire for beginners.
How do you draw a physics diagram that solves the problem?
Work in four layers, each linked to the next.
Picture. Sketch the situation and mark the object you care about. Write the givens and the unknown on the drawing, not in a separate list.
Free-body diagram. Draw that object alone. Add one arrow per force, and name what exerts it (Earth, surface, string). Choose axes that fit the motion.
Equations from arrows. Write Newton's second law along each axis, reading the terms off the diagram one arrow at a time.
Check against the picture. Ask whether the answer's direction, size and limiting cases match what the diagram shows.
Worked example: a block slides down a 30° incline. The coefficient of kinetic friction is 0.2. Find its acceleration, taking g = 9.8 m/s².
Picture: block on the slope, moving down it. Unknown: a.
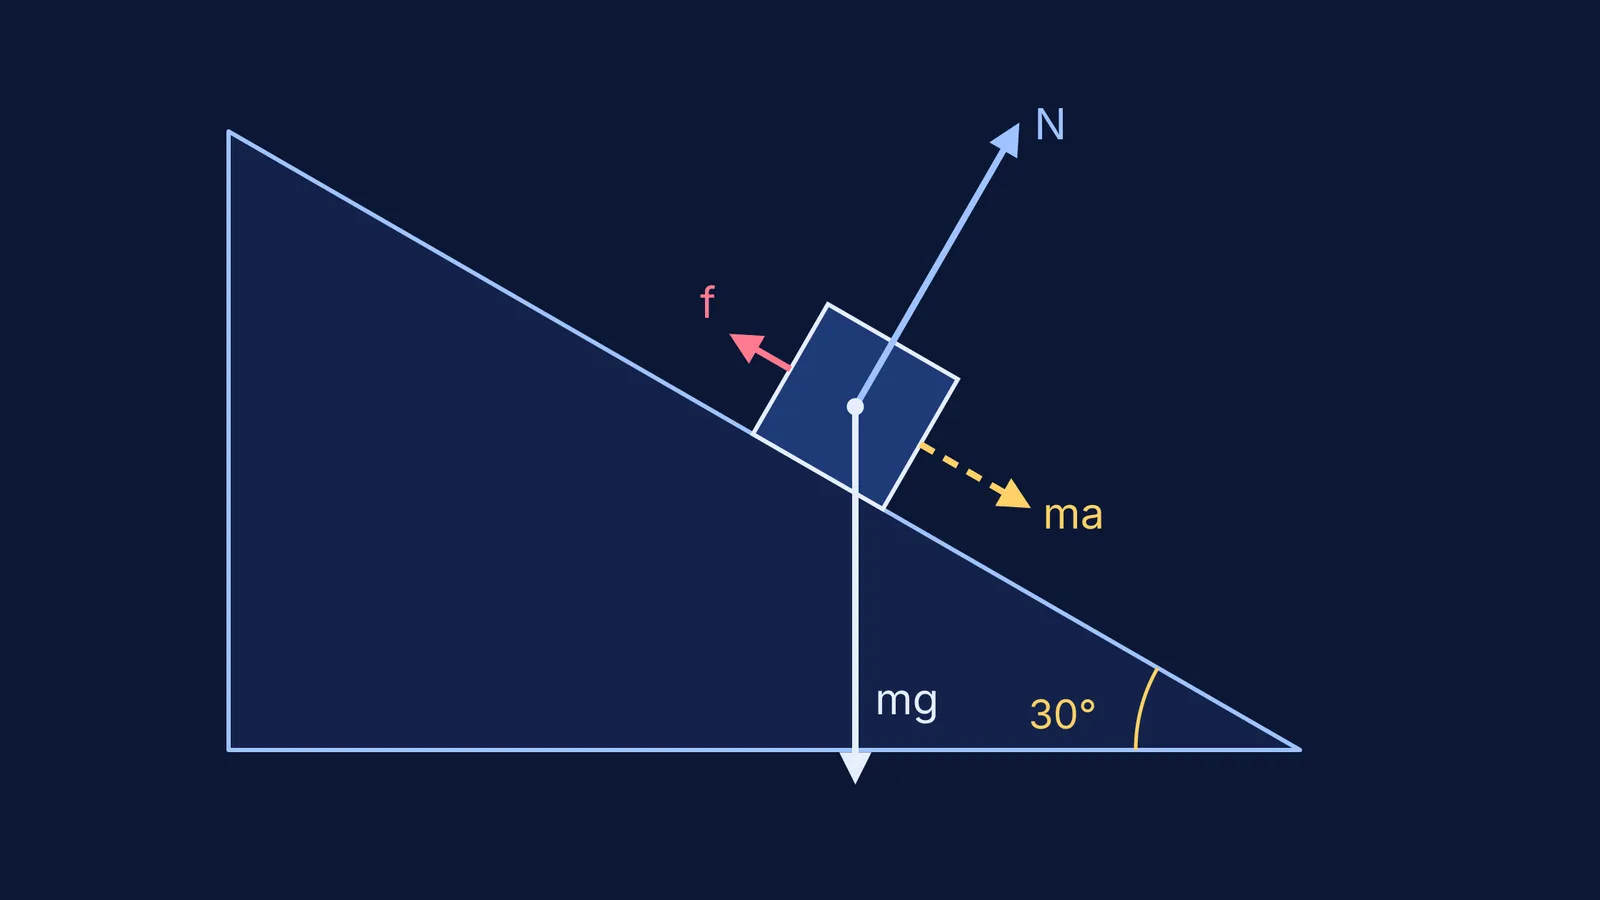
Free-body diagram: weight mg straight down (from Earth), normal force N perpendicular to the slope (from the surface), friction f up the slope, opposite the motion (from the surface). Axes along and perpendicular to the slope.
Equations: there is no acceleration perpendicular to the slope, so N = mg cos 30°. Along the slope, ma = mg sin 30° - 0.2 mg cos 30°.
Answer: a = 9.8 × (0.5 - 0.2 × 0.866), which is about 3.2 m/s² down the slope.
Now check with the diagram, as the stronger students in the 2009 study did. Without friction the answer would be g sin 30° = 4.9 m/s², so friction should make it smaller, and it does. If you had written N = mg, the diagram would catch it: N is perpendicular to the slope, and only part of the weight presses into the surface. The image at the top draws these forces to scale.
For more practice with this method, see Newton's second law with free-body diagrams: a five-step method.
What if you cannot picture the situation at all?
Some ideas, such as fields and waves, are hard to sketch from a description alone. Our post on simulations versus static diagrams looks at when each works better. If an idea is easier to see than to read, the Fermi Simulation Lab has interactive simulations you can run before you draw your own diagram. If your diagram is right but the method still goes wrong, the Fermi Problem Library has worked problems with a step-by-step solver that explains the reasoning.
Tonight, pick three problems you got wrong last week. Redraw each diagram, write one equation term per arrow, and check each answer against the picture.


