

On this page
A string clamped at both ends can only vibrate in certain patterns. Each pattern is a standing wave, and each one has its own frequency. A simulation lets you find these patterns in a few minutes, but only if you predict what you should see before you start clicking.
How many nodes does each harmonic have?
Start with the definitions. In OpenStax University Physics, section 16.6, a node is a point where the string's displacement is always zero, and an antinode is where it swings with the largest amplitude.
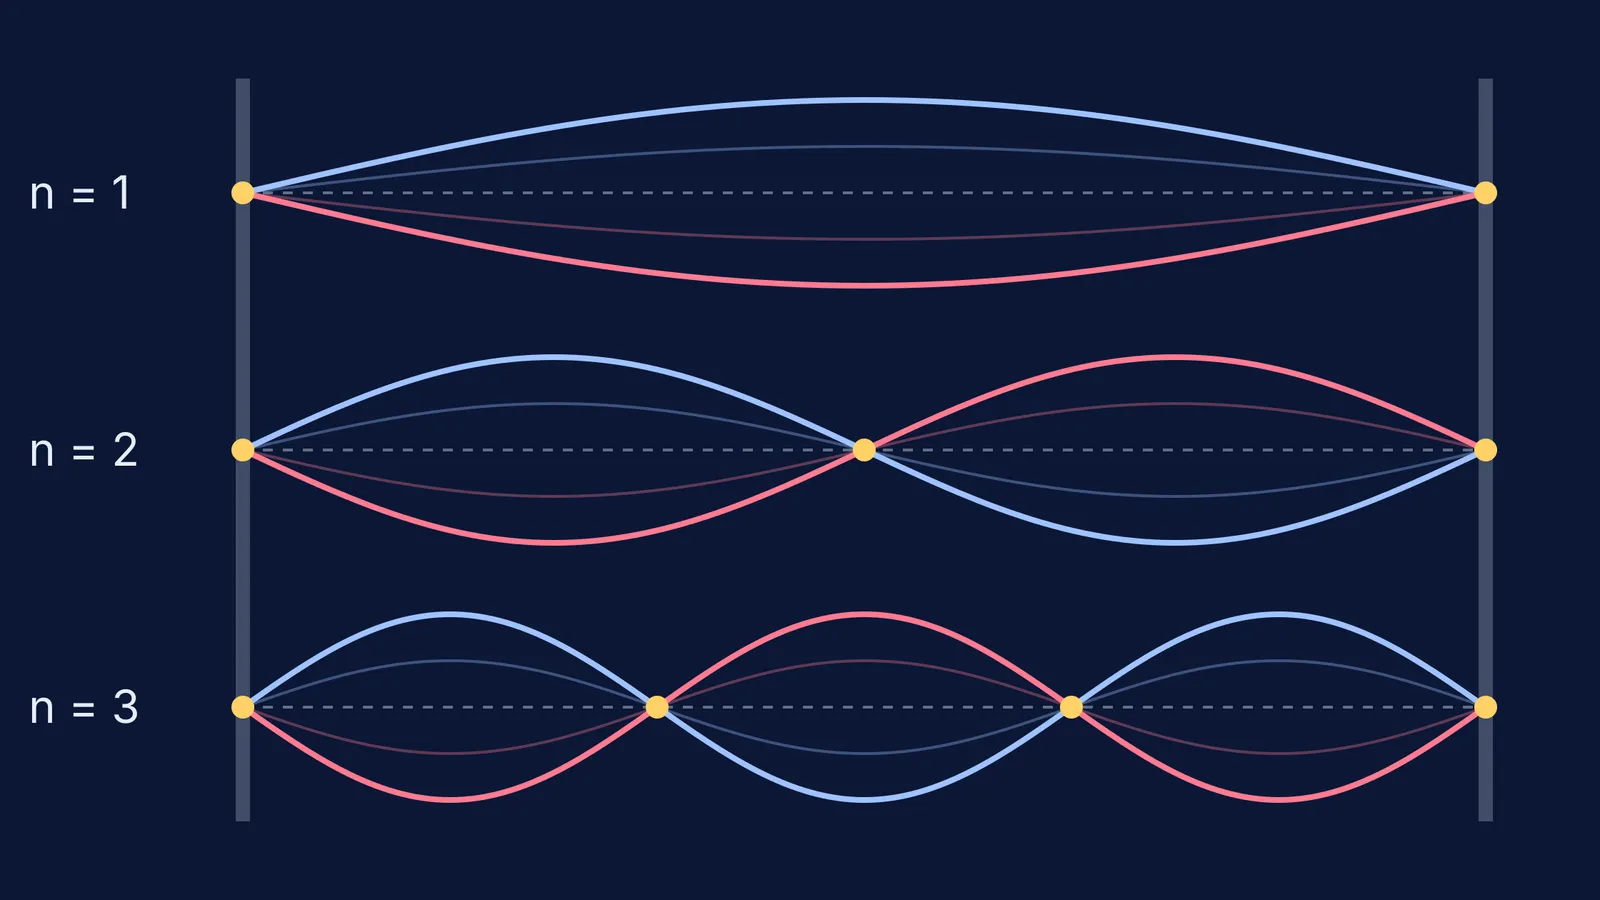
For a string of length L fixed at both ends, the allowed wavelengths are λₙ = 2L/n, where n = 1, 2, 3 and so on (OpenStax, equation 16.15). That means the nth harmonic fits exactly n half-wavelengths, or n loops, on the string.
Nodes sit half a wavelength apart, which here is L/n. Count them and you get a rule you can test on screen:
Harmonic n has n loops.
It has n antinodes, one in the middle of each loop.
It has n + 1 nodes if you count the two clamped ends, or n − 1 nodes between the ends.
How does frequency change with tension and length?
The wave speed on a string is v = √(T/μ), where T is the tension and μ is the mass per unit length (HyperPhysics, Georgia State University). Put that speed into fₙ = nv/2L (OpenStax, equation 16.16) and you get fₙ = (n/2L)√(T/μ).
Read the formula one variable at a time:
Length: f goes as 1/L. Double the length and every harmonic halves (HyperPhysics).
Tension: f goes as √T. To double the frequency you need four times the tension, not two (HyperPhysics).
Mass per unit length: f goes as 1/√μ. A string four times heavier per metre sounds at half the frequency.
Harmonic number: fₙ = n × f₁, so the harmonics are evenly spaced.
Worked example: predict before you touch the sliders
Use the numbers from OpenStax Example 16.7: a 2.00 m string with μ = 0.006 kg/m, kept taut by a 2.00 kg hanging mass. The tension is mg = 19.6 N, the wave speed works out to 57.15 m/s, and the first three harmonics are 14.29 Hz, 28.58 Hz and 42.87 Hz.
Now make predictions from those numbers, using the same formula:
Hang 8.00 kg instead (tension 78.4 N, four times larger): f₁ should double to about 28.6 Hz.
Keep 2.00 kg but halve the length to 1.00 m: f₁ should also double to about 28.6 Hz.
Double the tension only (39.2 N): f₁ should rise by √2, to about 20.2 Hz, not to 28.6 Hz.
The third one catches people out. Write all three down before you open the simulation.
How do you find harmonics in a simulation?
Many string simulations let you drive one end at a frequency you choose. A standing wave builds up only when the driving frequency matches one of the natural frequencies, so you are hunting for resonances.
Fix both ends and turn any damping or friction setting low, so patterns stay clear.
Start well below your predicted f₁ and raise the frequency slowly.
Stop when the amplitude grows large and the loops hold still. Note the frequency and count the loops.
Keep going to find n = 2, 3 and 4. Each should sit close to a whole-number multiple of f₁.
Change one thing only (tension, or length) and repeat.
Fermi Simulation Lab collects interactive simulations for ideas that are easier to see than to read, which is a good place to practise this predict-then-test habit. If you get stuck on why a pattern looks the way it does, Fermi's AI tutor can run the simulation with you and check your understanding as it goes.
How do you check f = (n/2L)√(T/μ) against your readings?
For each reading, compute the predicted frequency from the formula and the percentage difference: (measured − predicted) ÷ predicted × 100. Here is a made-up reading to show the arithmetic: if the three-loop pattern appears at 43.5 Hz on the example string, the difference from 42.87 Hz is about 1.5%.
A single match can be luck. A pattern is stronger evidence:
Plot f₁ against √T. The points should lie on a straight line through the origin.
Plot f₁ against 1/L. Again, a straight line through the origin.
Divide each fₙ by n. All the results should agree with f₁.
The same formula runs the lab version of this experiment, which our guide to the sonometer frequency experiment walks through. For how strings compare with air columns, see standing waves in strings and pipes, and for where these laws came from, read about Marin Mersenne and vibrating strings.


