

On this page
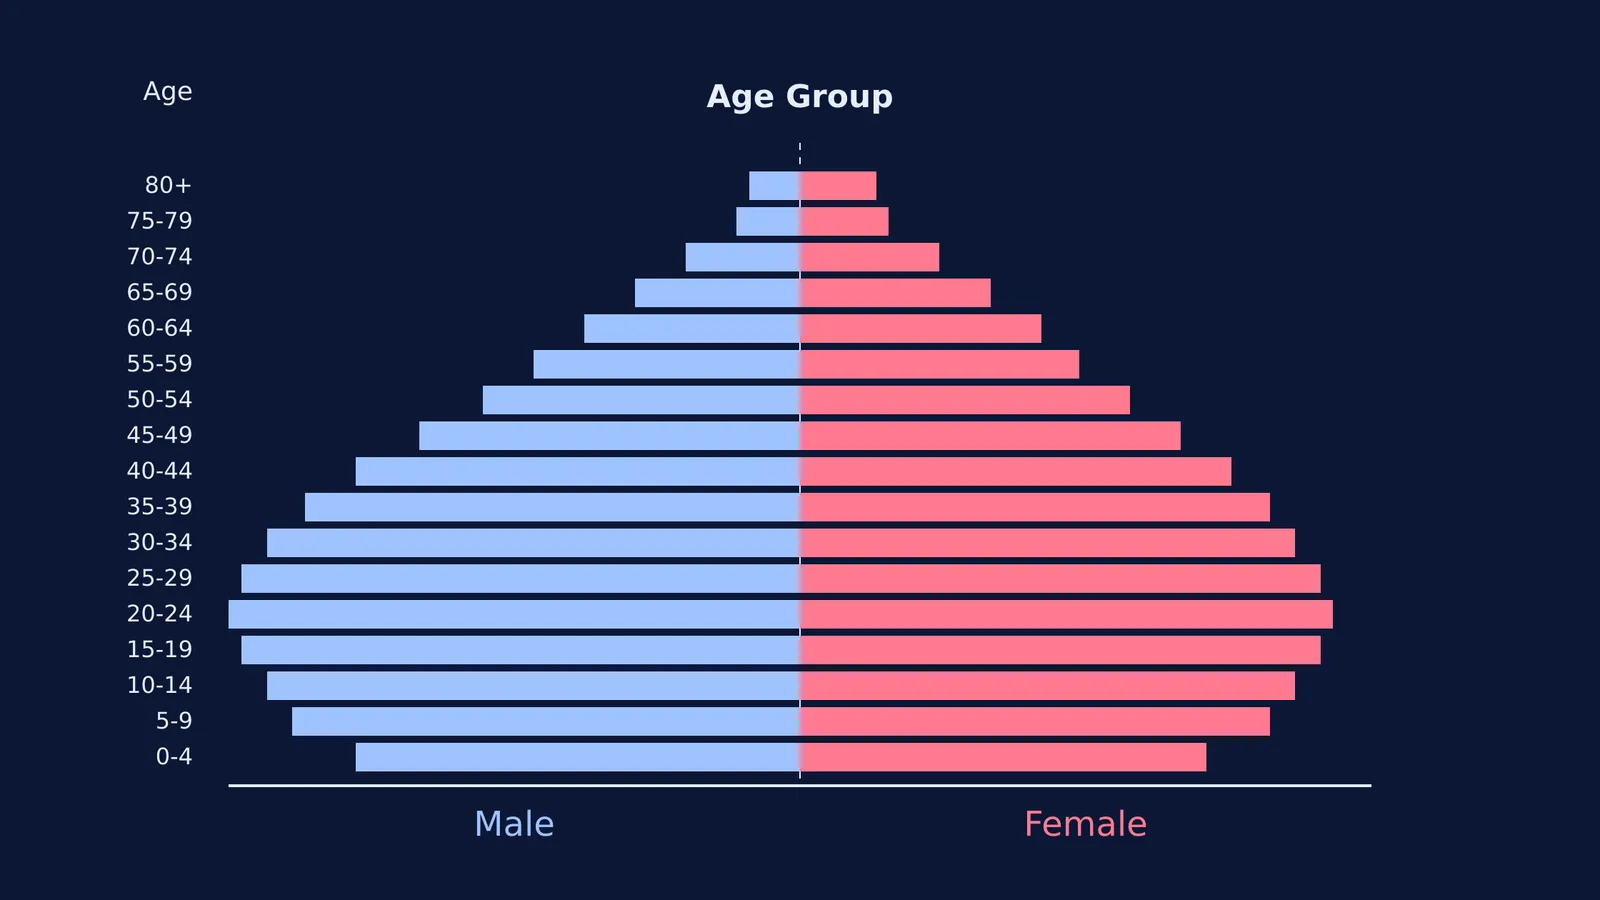
The shape of a population pyramid tells the story of a country's future. By plotting the number of males on the left and females on the right across different age groups, demographers can predict whether a society is about to boom, stabilize, or shrink.
What does a wide base vs. a narrow base indicate?
The base of an age pyramid represents a country's youngest citizens, typically those aged 0 to 14 years.
A wide base indicates a progressive, expanding population with high birth rates. This triangular shape is common in developing nations where large families are the norm and life expectancy is often lower. Because each successive generation is larger than the one before it, the population grows rapidly.
A narrow base indicates a declining population where birth rates have fallen. When the bottom bars of the pyramid are shorter than the bars in the middle, it means people are having fewer children.
India is currently shifting from an expanding pyramid to a constricting one. According to the National Family Health Survey (NFHS-5), India's total fertility rate has fallen to 2.0. Because this is below the 2.1 replacement level—the average number of children per woman needed to keep a population stable—the base of India's age pyramid is beginning to pull inwards.
How do you identify a stable population from a pyramid?
A stable population looks like a bell or a barrel, where the numbers in the pre-reproductive and reproductive age groups are roughly equal. In this stage, birth and death rates balance each other out, leading to zero or near-zero population growth.
Demographers use these shapes to predict a country's future economic and social needs. A bulge in the 0–4 age group means the country must build primary schools today and create university places in a decade. However, as the fertility rate drops and the pyramid turns into a rectangle or an urn shape, the challenge shifts to supporting an aging society.
The United Nations Population Fund (UNFPA) India Ageing Report 2023 projects that the elderly population (aged 60 and above) will reach 20.8% of India's total population by 2050. This means one in every five Indians will be a senior citizen. This "graying" of the population requires a shift in economic focus from building schools to providing healthcare infrastructure and pensions, as fewer young workers must support more retirees.
How do you read an age pyramid in three steps?
If you are studying for a biology or geography exam, you can identify any country's demographic stage by applying this framework:
Check the base (0–14 years): A wide, flared base means high birth rates and rapid population growth. A base narrower than the middle means birth rates are falling below replacement level.
Look at the middle (15–59 years): A straight-sided, barrel-like middle indicates a stable population where the workforce is large and steady.
Examine the peak (60+ years): A sharp, needle-like top means low life expectancy. A thick, widening top indicates an aging population where people live much longer.
Where can you see demographic transition in action?
Reading a static graph in a textbook is one thing, but seeing how birth rates alter the shape over time makes the mathematics of population growth clear. You can explore how changing variables reshapes a society in the Fermi Simulation Lab.
In the lab, you can adjust the fertility rate and life expectancy sliders, and watch the interactive age pyramid warp in real time. If you increase the birth rate, the base flares out into a triangle. If you lower the birth rate to 1.5, you can watch the bottom pinch inwards, gradually pushing the demographic bulge up into the older age brackets over simulated decades.
If you are studying biology and need to master population ecology, the Fermi Concept Library breaks down the biology of population dynamics. When you hit a roadblock, Fermi's AI tutor can work out what you already know and build a plan for the session, so you sit down to a clear next step instead of a blank page.
For more on biological models and curves, read our guides on stabilising, directional and disruptive selection and arithmetic vs geometric growth in plants.


