

On this page
A system of linear equations is consistent if it has at least one solution, and inconsistent if it has no solution (https://en.wikipedia.org/wiki/System_of_linear_equations). When you are faced with a pair of linear equations in two variables, you do not have to plot them to find out what they will do.
By checking the ratios of their coefficients, you can predict whether the lines will cross, run parallel, or lie exactly on top of each other.
What makes a pair of linear equations consistent or inconsistent?
A linear equation in two variables forms a straight line on a graph. When you have a pair of these equations, their relationship determines how many solutions they share.
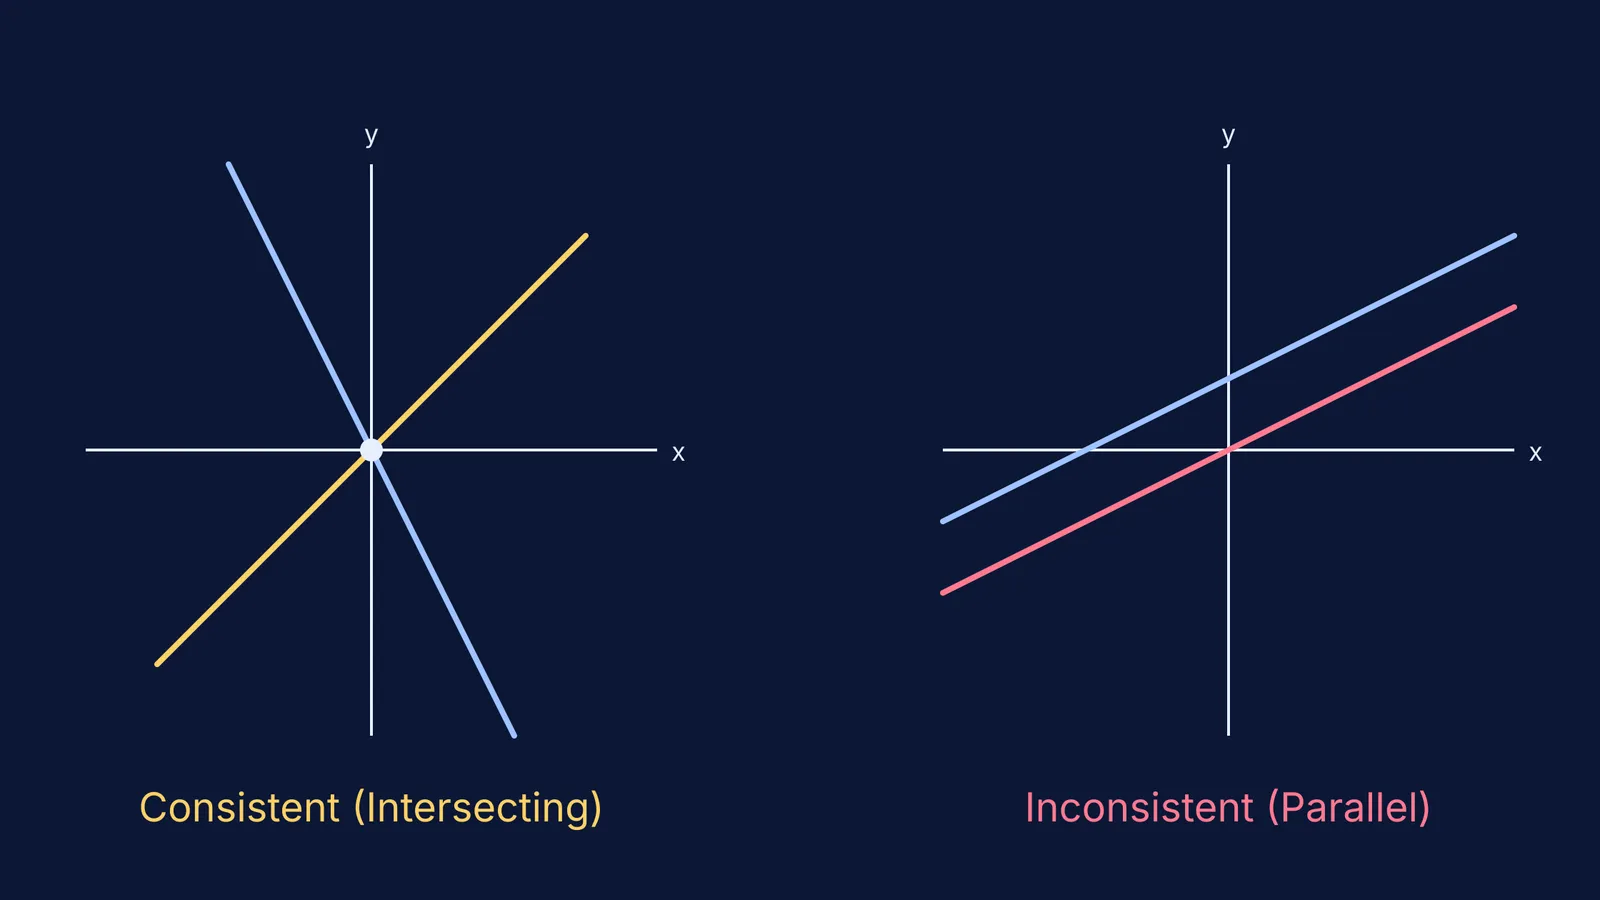
Consistent (Independent): The lines intersect at exactly one point. There is one unique solution.
Consistent (Dependent): The lines coincide, meaning one line lies exactly on top of the other. Every point on the line is a shared solution, so there are infinitely many.
Inconsistent: The lines are perfectly parallel. Because they never meet, there is no shared point and no solution.
How can you predict the graph from the coefficients?
You can skip straight to the answer by comparing the coefficients of the two equations. Write your equations in the standard form: a₁x + b₁y = c₁ and a₂x + b₂y = c₂. (You can also use a₁x + b₁y + c₁ = 0, as long as both equations use the same format).
Then, compare the ratios a₁/a₂ (for the x terms), b₁/b₂ (for the y terms), and c₁/c₂ (for the constants):
If a₁/a₂ ≠ b₁/b₂: The lines will intersect at exactly one point. The system is consistent.
If a₁/a₂ = b₁/b₂ = c₁/c₂: The equations represent the same line. The system is consistent and dependent.
If a₁/a₂ = b₁/b₂ ≠ c₁/c₂: The lines are parallel. The system is inconsistent.
For example, take 2x + 3y = 6 and 4x + 6y = 12. The ratios are 2/4, 3/6, and 6/12. Since they all simplify to 1/2, the lines coincide.
If you want to find the number of roots by counting the intersections of two sketched curves, this quick ratio check tells you exactly what to expect before you start drawing.
The Cartesian connection: why do students struggle with graphs?
Knowing the rules is one thing, but trusting the graph is another. In 2000, mathematics educator Eric J. Knuth published "Understanding Connections between Equations and Graphs" in *The Mathematics Teacher* (https://doi.org/10.5951/MT.93.1.0048). Knuth presented students with a graph of a linear equation, such as x + y = 10, and asked them to find a point that was a solution. He found that over 90% of students chose an algebraic approach, picking an x value and solving for y, instead of simply reading an intercept off the drawn line. They missed the "Cartesian connection": the fundamental idea that a point is on the graph if and only if it satisfies the equation. Students often view equations as the "real" math and the graph as just a picture.
How can you see the lines clearly?
When you are learning to trust graphs over algebra, it helps to see the lines shift as you change the numbers. The Fermi Simulation Lab lets you adjust the coefficients of linear equations and watch how the lines react. You can see intersecting lines become parallel as their slopes align, turning a consistent system into an inconsistent one right before your eyes.
Practising with this visual feedback builds the Cartesian connection Knuth wrote about, proving that the algebra and the geometry are telling you exactly the same story. Whether you are dealing with quadratic word problems in Class 10 or stepping up to Gabriel Cramer's determinant rule of 1750 for larger systems, a strong grasp of the graph keeps you grounded.


