

On this page
School apps, coaching portals and mock-test platforms now hand you charts: a score line, a percentile, a topic grid, sometimes a rank against thousands of students. Do they help you learn? The research says not on their own, and how a chart compares you with others matters more than you might expect.
Do learning dashboards actually improve marks?
A learning analytics dashboard is a screen that turns data about your study, such as test scores, time spent or questions attempted, into charts meant to help you decide what to do next.
A 2024 systematic review of 38 studies by Rogers Kaliisa and colleagues found no evidence that dashboards had lived up to the promise of improving academic achievement; most studies reported negligible or small effects (Kaliisa et al., 2024). Dashboards did better at raising participation, though the authors flagged small samples and self-selection bias as recurring weaknesses.
An earlier review found that dashboards were rarely grounded in learning theory and offered no information about effective learning tactics and strategies (Matcha et al., 2020). Another review, of 28 studies screened from 1,297 papers, found that dashboards were mostly built to improve learning but mostly evaluated by how students felt about them (Valle et al., 2021).
A chart tells you where you are. It rarely tells you what to do next, and that is where learning happens.
Why can comparing yourself with peers backfire?
Feedback is not automatically good. A 1996 meta-analysis of 607 effect sizes from 23,663 observations found that feedback improved performance on average, but more than a third of feedback interventions made performance worse (Kluger and DeNisi, 1996). Their explanation: feedback helps less as it pulls attention away from the task and towards the self.
A rank, or a bar showing you against the class average, is that kind of self-focused feedback. It answers "how do I look?" rather than "what went wrong in question 14?". A review of learner dashboards by Ioana Jivet and colleagues reported that comparison with peers, a common way dashboards frame data, was not perceived positively by all learners (Jivet et al., 2018).
Comparison is not always harmful, though. In two randomised trials in university courses, Damien Fleur and colleagues showed students their performance next to peers with similar goal grades, chosen to be slightly ahead. The dashboard raised extrinsic motivation and achievement, though not metacognition (Fleur et al., 2023). So if you compare at all, compare with people a little ahead of you aiming for the same thing, not with an all-India topper. Our guide on using rank lists without losing motivation goes further.
How should you read your own progress data?
Ask three questions every time you open a chart.
Against what? Compare with your own last few tests, not with one classmate or the topper.
Where exactly? Find the chapter, question type or mistake type that cost the most marks.
So what next? Write one action for the coming week that you can check.
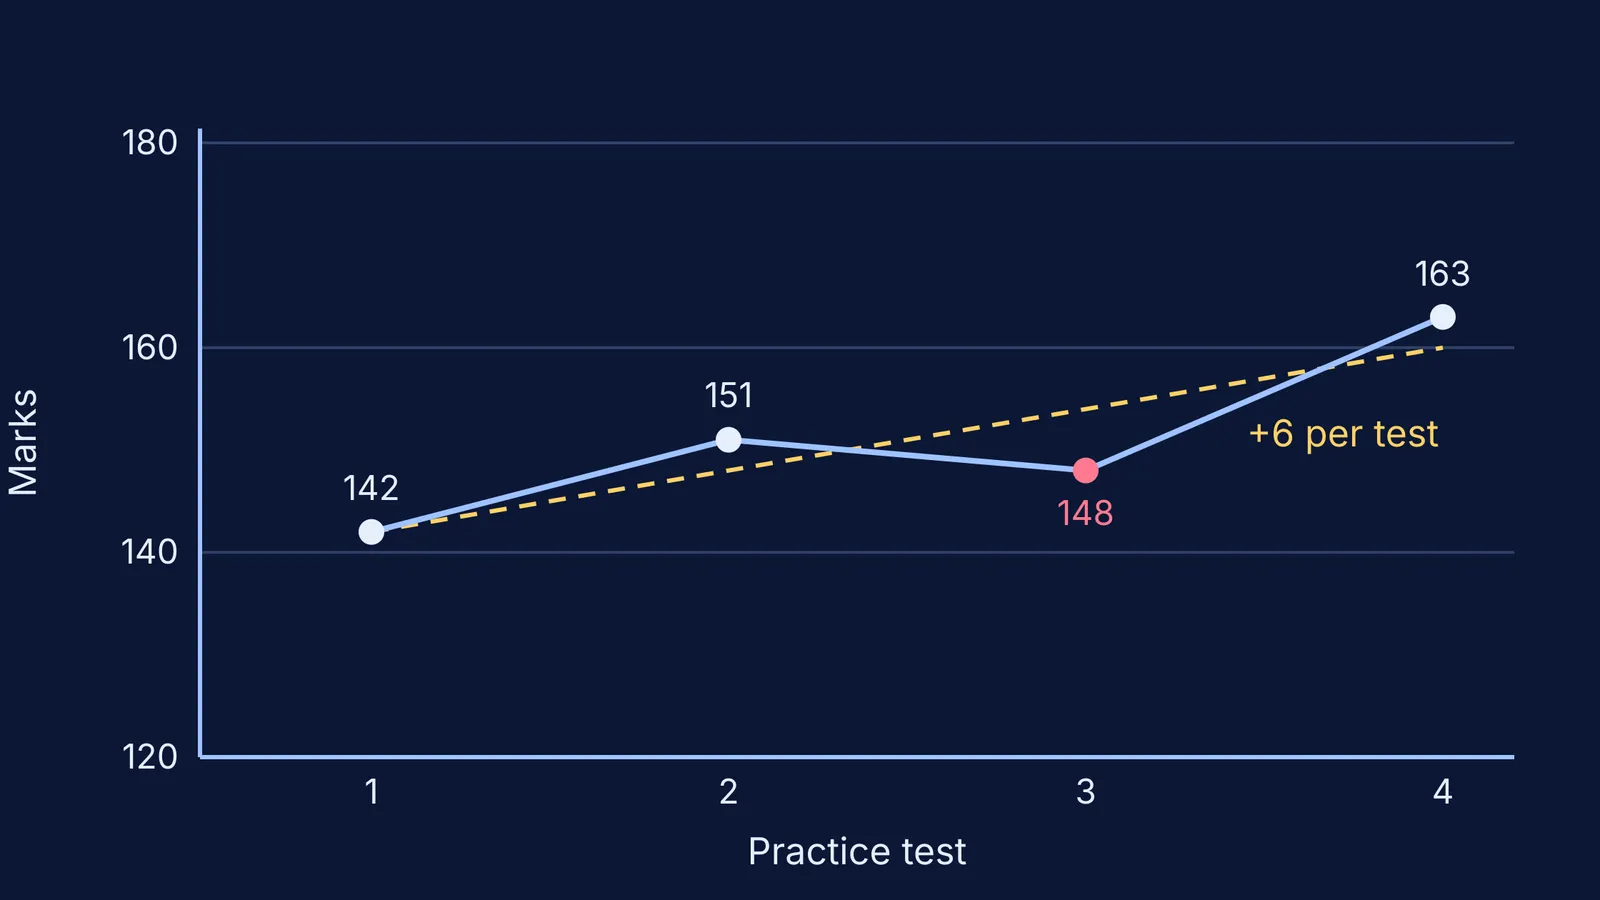
Take an example. Riya has marks from four practice tests: 142, 151, 148 and 163. After the third test she felt she was slipping. But a straight trend line fitted through all four rises by 6 marks per test (a least-squares fit, shown in the chart at the top of this post). One dip is noise; the direction across all four tests is the signal.
Now the "where" question. Her topic grid shows rotational motion at 3 correct out of 8. Four of her five wrong answers came from choosing the wrong axis for moment of inertia, not calculation slips. That gives a clear "so what": relearn the parallel and perpendicular axis theorems, solve ten mixed problems, and check whether that topic rises in the next test.
For separating accuracy, time and attempts, see how to use your mock test data. If the "where" is a concept you never quite understood, the Fermi Concept Library gives every concept in physics, chemistry, biology, mathematics and computing its own lesson. If you are not sure where to start, Fermi's AI tutor works out what you already know and builds a plan for the session.
What should parents say when they see the chart?
A parent looking at a red cell or a falling rank often reaches for comparison: "Your friend scored 180." That pulls attention to the self, the pattern the feedback research warns about. Try these instead:
"Which chapter moved most since last month?"
"What kind of mistake was this: concept, method or a careless slip?"
"What is one thing you will try before the next test, and how will we know it worked?"
Our piece on why comparing siblings backfires has more phrases that keep the focus on effort and strategy.
If a dashboard leaves your child anxious for days or avoiding study altogether, talk to a school counsellor or a doctor. Tele MANAS, the free 24x7 national mental-health helpline from the Ministry of Health and Family Welfare, is on 14416 or 1800-891-4416 (IIT Kanpur counselling page on Tele MANAS).
Next time you open a progress chart, ask the three questions, write down one action, and close the app.


